The exciting world of ecommerce has a lot of moving parts. How do you keep them all spinning the way they’re supposed to? An inventory management system goes a long way in that department.
What is Inventory Management?
Inventory management includes tracking the following aspects of a business supply chain:
- Controlling and overseeing purchases
- Maintaining storage of stock
- Controlling the amount of product for sale
- Order fulfillment
Benefits of Inventory Management
Save Money
Knowing your inventory inside and out helps you manage your money better.
Improve Cash Flow
Spending money on inventory that sells well keeps cash flowing for your business.
Improve Customer Satisfaction
Customers become repeat customers when their orders arrive without a hitch.
Early Problem Detection
Keeping a close eye on inventory helps you notice problems before they get out of control.

Inventory Management Challenges to Overcome
Getting Accurate Stock Details
It’s hard to properly manage your inventory if you don’t have accurate data on what you have in stock.
Processes That Need Improvement
Inventory management can fix problems caused by outdated, inefficient processes.
Changing Customer Demand
Customers’ tastes and preferences change all the time. That’s why a system that effectively tracks trends is essential.
Efficient Use of Warehouse Space
Inefficient use of warehouse space wastes employees’ time. Inventory management can solve that problem.
Types of Inventory
Raw Materials
Any items used to manufacture components or finished products. These can be items produced directly by your business or purchased from a supplier.
‘Work in Progress’ Goods
Unfinished items moving through production but not yet ready for sale.
Finished Goods
Products that have completed the production process and are ready to be sold.
Anticipation Inventory
Prepare for the high demand points by stocking up during low points. This technique is popular with businesses that have seasonal peaks.
Maintenance, Repair, and Operating Supplies (MRO)
Items used in the production of finished goods that are not part of the finished product.

Inventory Management Terms
ABC Analysis
Separating stock into categories in order of importance. A is the most important, C is the least important.
Barcode Scanner
Handheld devices used to check-in and check-out stock items.
Batch Tracking
Grouping similar items to track expiration dates and trace defective items.
Bundles
Groups of products that are sold as a single product. For example, selling a camera and camera accessories under one SKU.
Cost of Goods Sold (COGS)
Direct costs associated with production and storing of goods.
Cross-Merchandising
Cross-merchandising increases sales of your surplus inventory and slow-moving items. Sometimes it means selling excess inventory on eBay, Amazon, or social media marketplaces. That's called a multichannel approach. If you donate the surplus to a nonprofit, you can get a tax deduction of up to two times the cost of the donated products.
Demand Forecasting
Using predictive analytics to predict customer demand.
Economic Order Quantity (EOQ)
How much product you should reorder.
FIFO (First-in, First-out)
First in, first out (FIFO) means you move the oldest stock first. This is the best approach for perishable items.
Holding Costs
The costs your business incurs to store and hold stock in a warehouse until it’s sold to the customer. This is also known as carrying costs.
Landed Costs
Costs related to the moving of items. This includes shipping, storing, import fees, duties, taxes, and more.
Lean Manufacturing
Lean manufacturing removes any redundancies from the manufacturing process.
LIFO (last-in, last-out)
Last in, first out (LIFO) sells the stock purchased recently first. This is the most efficient process for non-perishable items.
Order Fulfillment
The processing of an order from the point of sale to shipping to the customer.
Order Management
Back end mechanisms related to
- Receiving orders
- Processing payments
- Fulfillment
- Tracking
- Communicating with customers

Par Levels
Par levels are the minimum quantities you wish to have in stock for each product. If your inventory counts go below that level, you know that you need to reorder that product.
Perpetual Inventory Management
This technique involves recording stock sales and usage in real-time.
Pipeline Inventory
Any inventory that is in production or shipping but hasn’t reached its final destination.
Purchase Order (PO)
A contract between a supplier and buyer outlining types, quantities, and agreed prices.
Reorder Point
Quotas that determine when reordering should take place.
Safety Stock
Extra inventory that’s set aside in case of manufacturing failures. This is also known as decoupling stock or decoupling inventory.
Sales Order
The transactional document sent to customers between purchase and fulfillment.
Stock Keeping Unit (SKU)
A unique tracking code assigned to each of your products and the variations on the products.
Surplus Inventory
Any excess inventory that isn't sold. Surplus inventory can lead to dead stock without an effective inventory management strategy.

Third-Party Logistics (3PL)
Third-party logistics refers to using an external provider to handle inventory-related operations. This includes warehousing, fulfillment, shipping, or any other part of the supply chain.
Variant
Unique version of a product, such as a specific color or size.
Inventory Management Techniques
Bulk Shipments
It’s always cheaper to ship products in bulk than individually. That’s why bulk shipping is a popular inventory management technique. Bulk shipments cost more money upfront for warehousing. But, this cost is usually offset by the money you save on shipping.
ABC Inventory Management
ABC inventory management starts with putting products in categories based on importance. A products are the most important and C products are the least important.
- A: Items of high value (70%) and small in number (10%)
- B: Items of moderate value (20%) and moderate in number (20%)
- C: Items of small value (10%) and large in number (70%)
Treat each category separately when it comes to resource allocation and management.
Backordering
Backordering is taking orders for products that are not currently in stock. Some retailers do this by changing the call to action on the “buy now” button to “pre-order.” Others don’t place an order to their supplier until they get enough backorders to make it a bulk shipment.
.jpg?width=2048&name=fabio-oyXis2kALVg-unsplash%20(1).jpg)
Just-In-Time Inventory (JIT)
A JIT approach involves only stocking the inventory you need at the moment. This approach saves money on inventory holding, but it can be risky if something goes wrong.
Consignment
Consignment involves a wholesaler maintaining ownership of stock until the retailer sells it. Most of the risk in a consignment arrangement falls on the wholesaler. The important things to establish in a consignment agreement include:
- Return, freight, and insurance policies
- How, when, and what customer data is exchanged
- Percentage of the purchase price retailer will be taking as sales commission
Dropshipping and Cross-Docking
These techniques eliminate holding costs altogether. In a dropshipping agreement, there is no need for inventory storage. The supplier ships the finished products to the customers directly. In a cross-docking agreement, transporters of products don't go to warehouses. Instead, they load and unload directly onto each other.
Inventory Cycle Counting
Cycle Counting is counting a small amount of stock instead of taking an entire stocktake. There are three main types of inventory cycle counts that you can use:
Control group cycle counting
Counting the same items many times over a short period. The idea is to notice errors in the count technique, and then fix the process.
Random sample cycle counting
Randomly select a certain number of items to count during each cycle count. That way you can carry out a count during business hours without disruption.
ABC cycle counting
Remember ABC strategy? With this approach, A items are counted more frequently than B and C items.
.jpg?width=3687&name=mitchell-hollander-8b1cWDyvT7Y-unsplash%20(1).jpg)
Materials Requirements Planning (MRP)
This inventory management method is sales-forecast dependent. That means you need accurate sales records to plan and communicate inventory needs.
Days Sales of Inventory (DSI)
DSI is a the average time in days that a company takes to turn its inventory into sales. DSI is also called
- the average age of inventory
- days inventory outstanding (DIO)
- days in inventory (DII)
- days sales in inventory
- days inventory
Periodic Inventory Management
Periodic Inventory Management involves:
- Taking inventory at the beginning of a period
- Adding new inventory purchases during the period
- Deducting ending inventory to derive the cost of goods sold (COGS)
RFID Inventory Management
Radio frequency identification (RFID) wirelessly transmits serial numbers for tracking and providing product details. RFID can
- improve efficiency
- increase inventory visibility
- self-record receiving and delivery
.jpg?width=5472&name=pradamas-gifarry-_5I6LhVCVjo-unsplash%20(1).jpg)
Inventory Management Formulas
Economic Order Quantity (EOQ) Formula
EOQ = √(2DK / H), or the square root of (2 x D x K / H)
Where
D = Setup or order costs (per order, generally includes shipping and handling)
K = Demand rate (quantity sold per year)
H = Holding or carrying costs (per year, per unit)

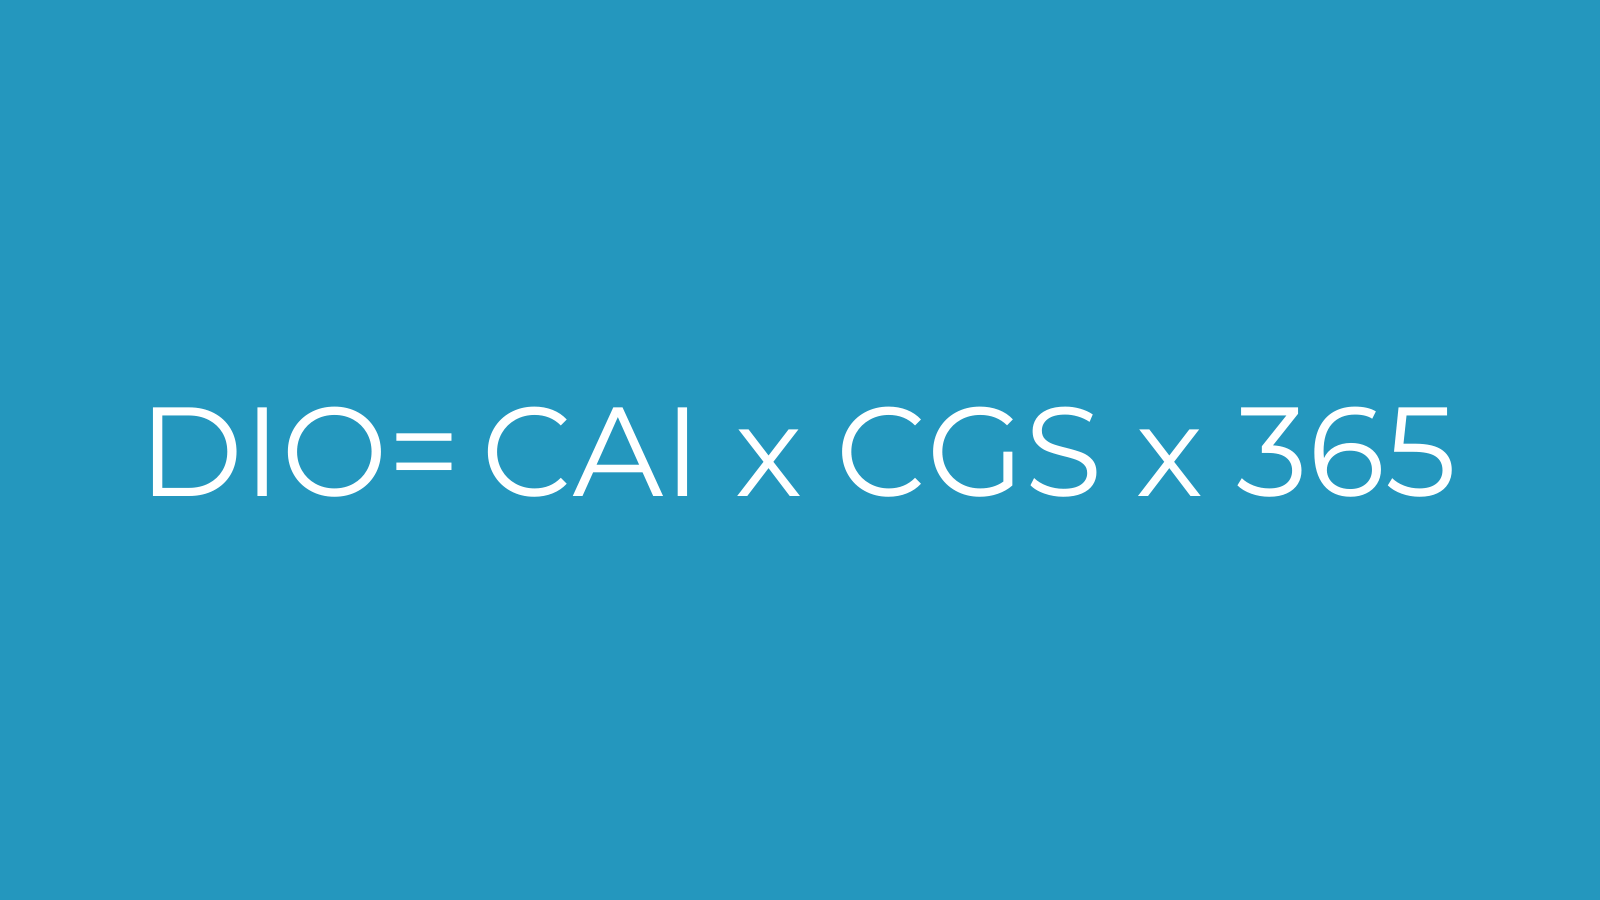
Days Inventory Outstanding (DIO) Formula
DIO= CAI x CGS x 365
Where CAI= Cost of Average Inventory
CGS= Cost of Goods Sold
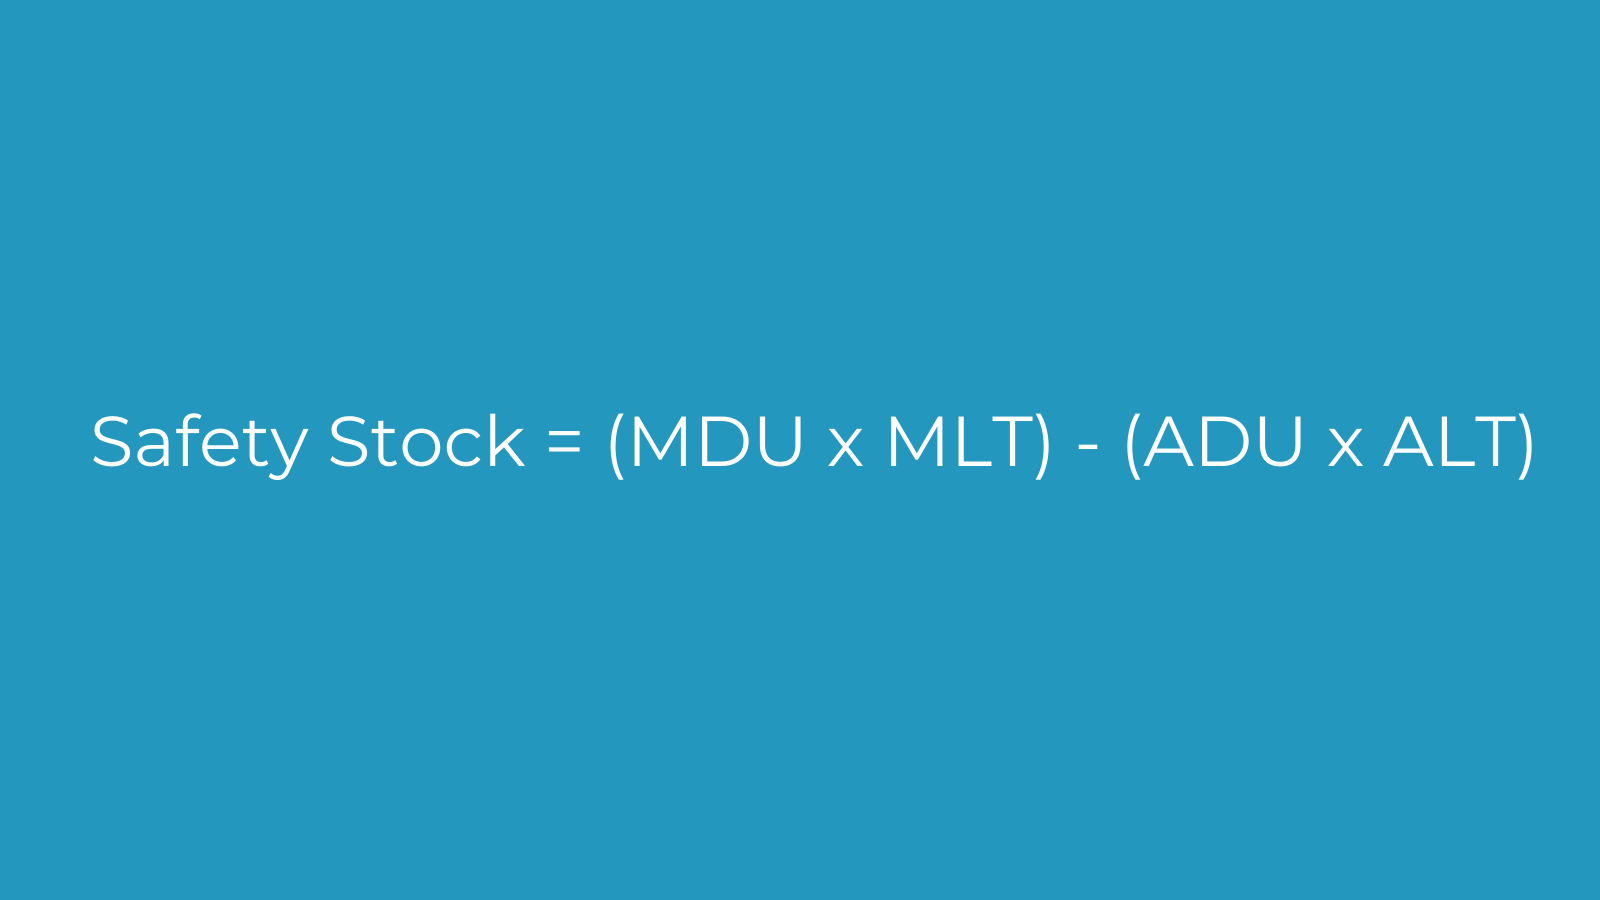
Safety Stock Formula
Safety Stock = (MDU x MLT) - (ADU x ALT)
Where
MDU = Maximum Daily Usage
MLT = Maximum Lead Time (in days)
ADU = Average Daily Usage
ALT = Average Lead Time (in days)
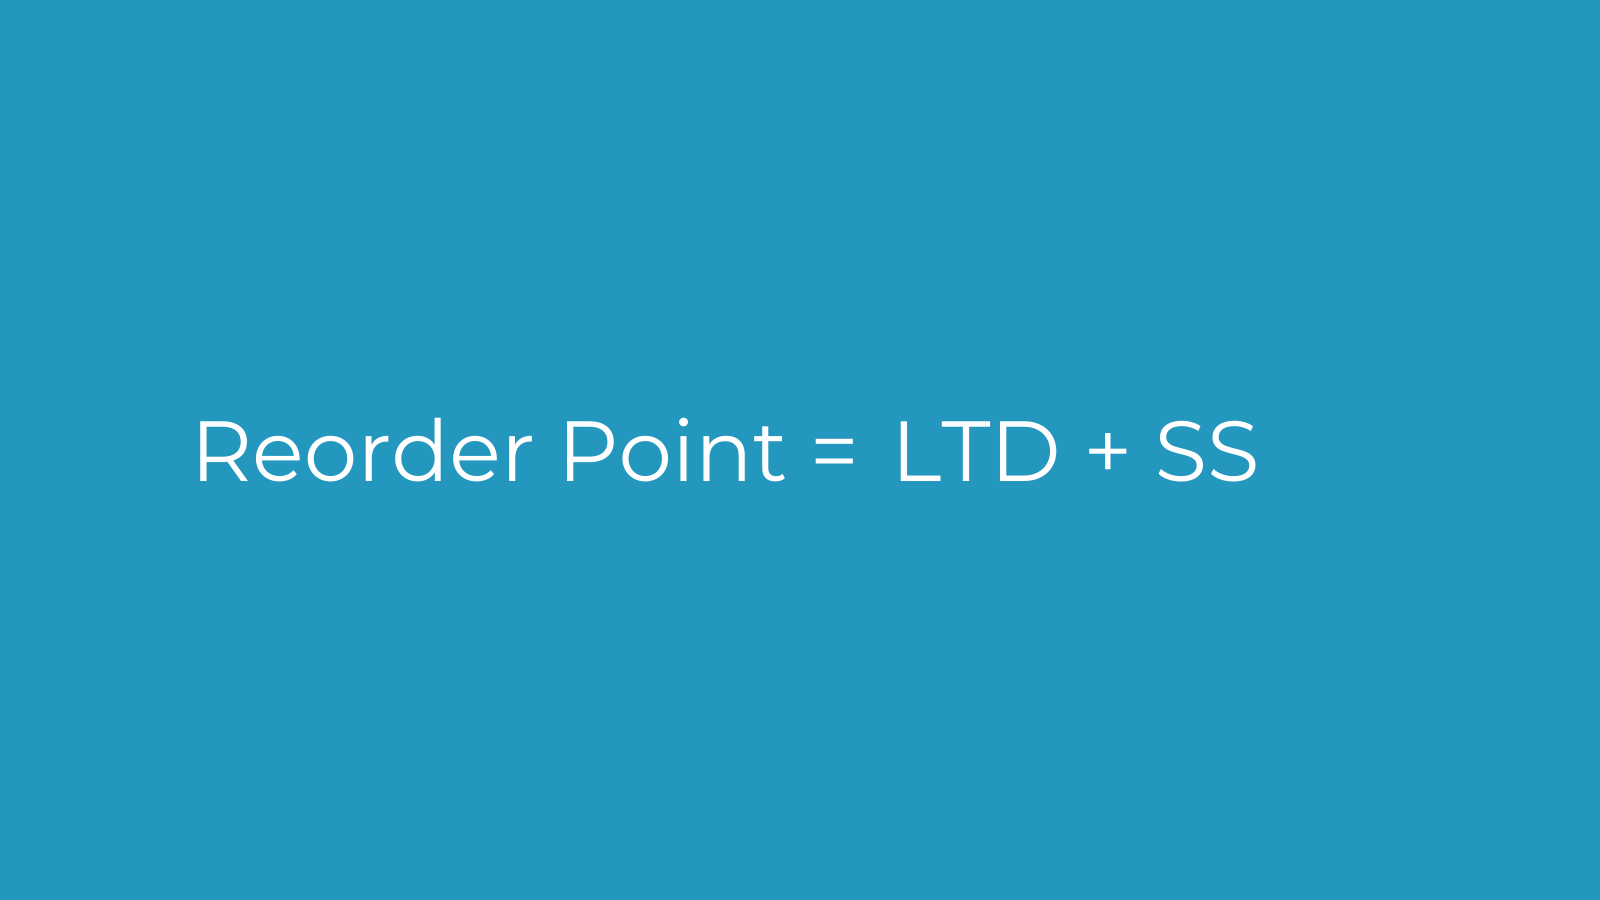
Reorder Point Formula
Reorder Point = LTD + SS
Where
LTD = Lead Time Demand
SS = Safety Stock
Inventory Management KPIs
Sales KPIs
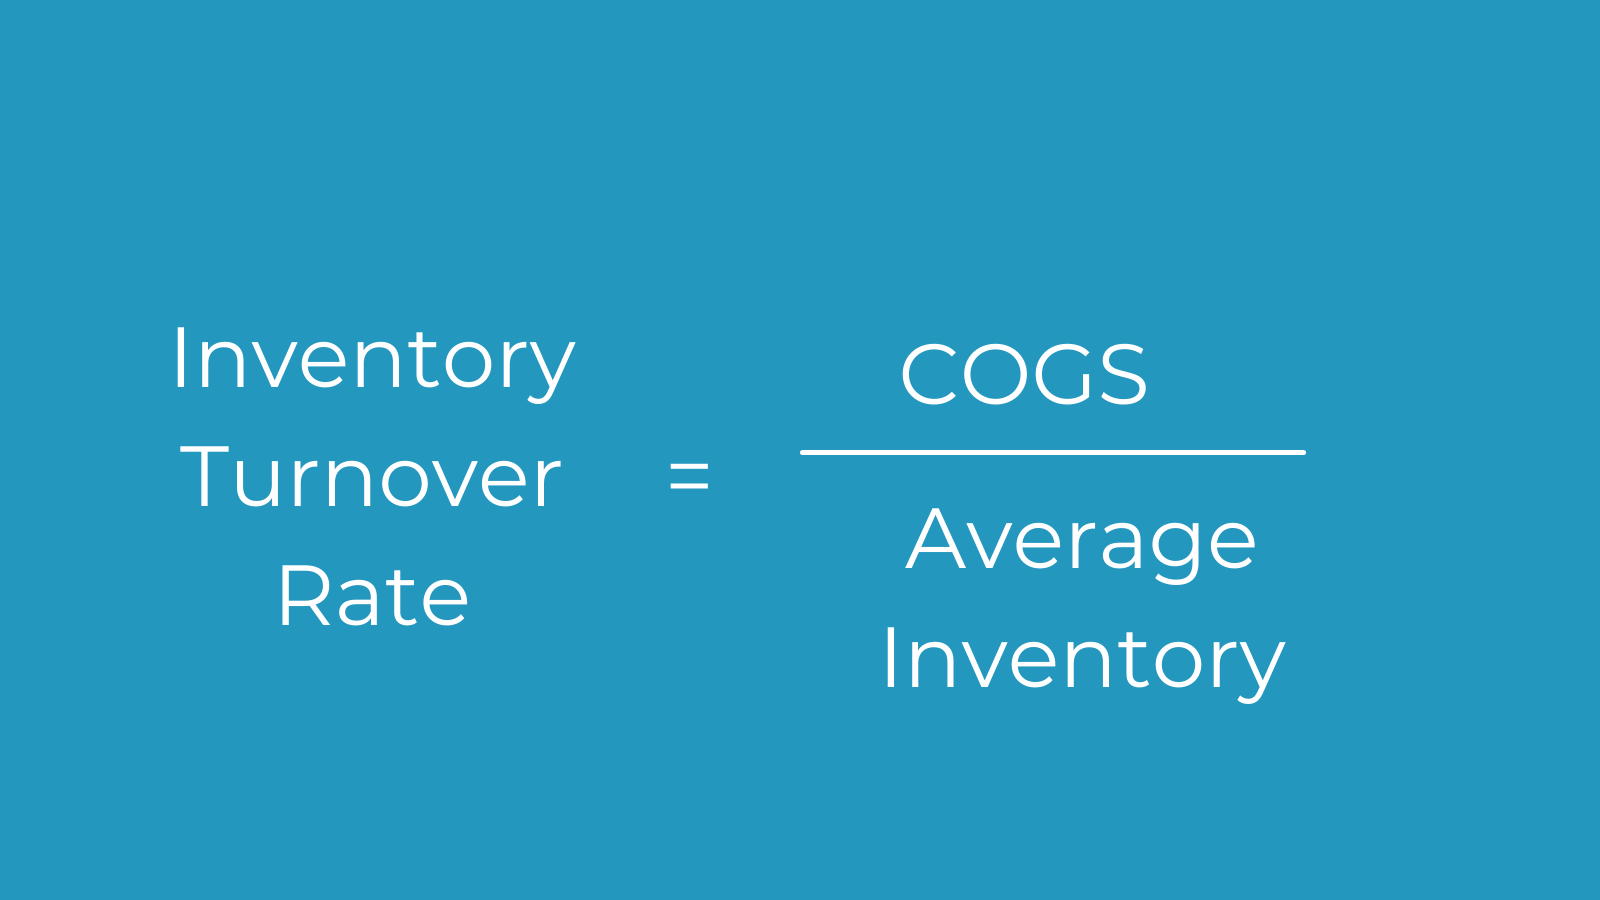
Inventory Turnover Rate
Inventory turnover rate = cost of goods sold / average inventory
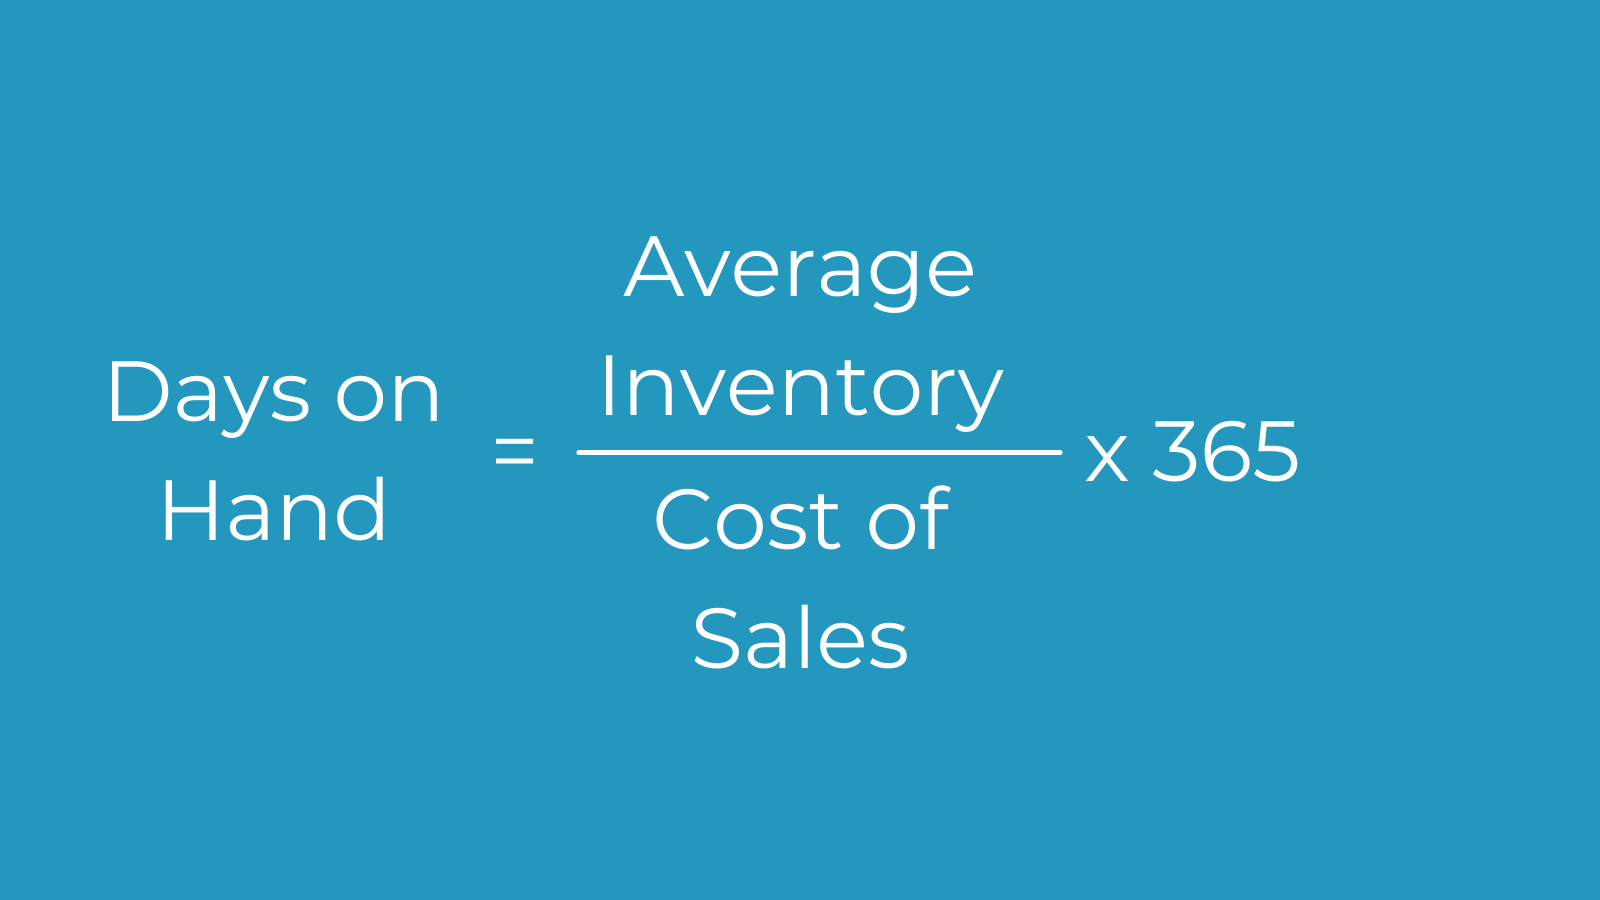
Days on Hand
Days of inventory on hand = (average inventory for period / cost of sales for period) x 365
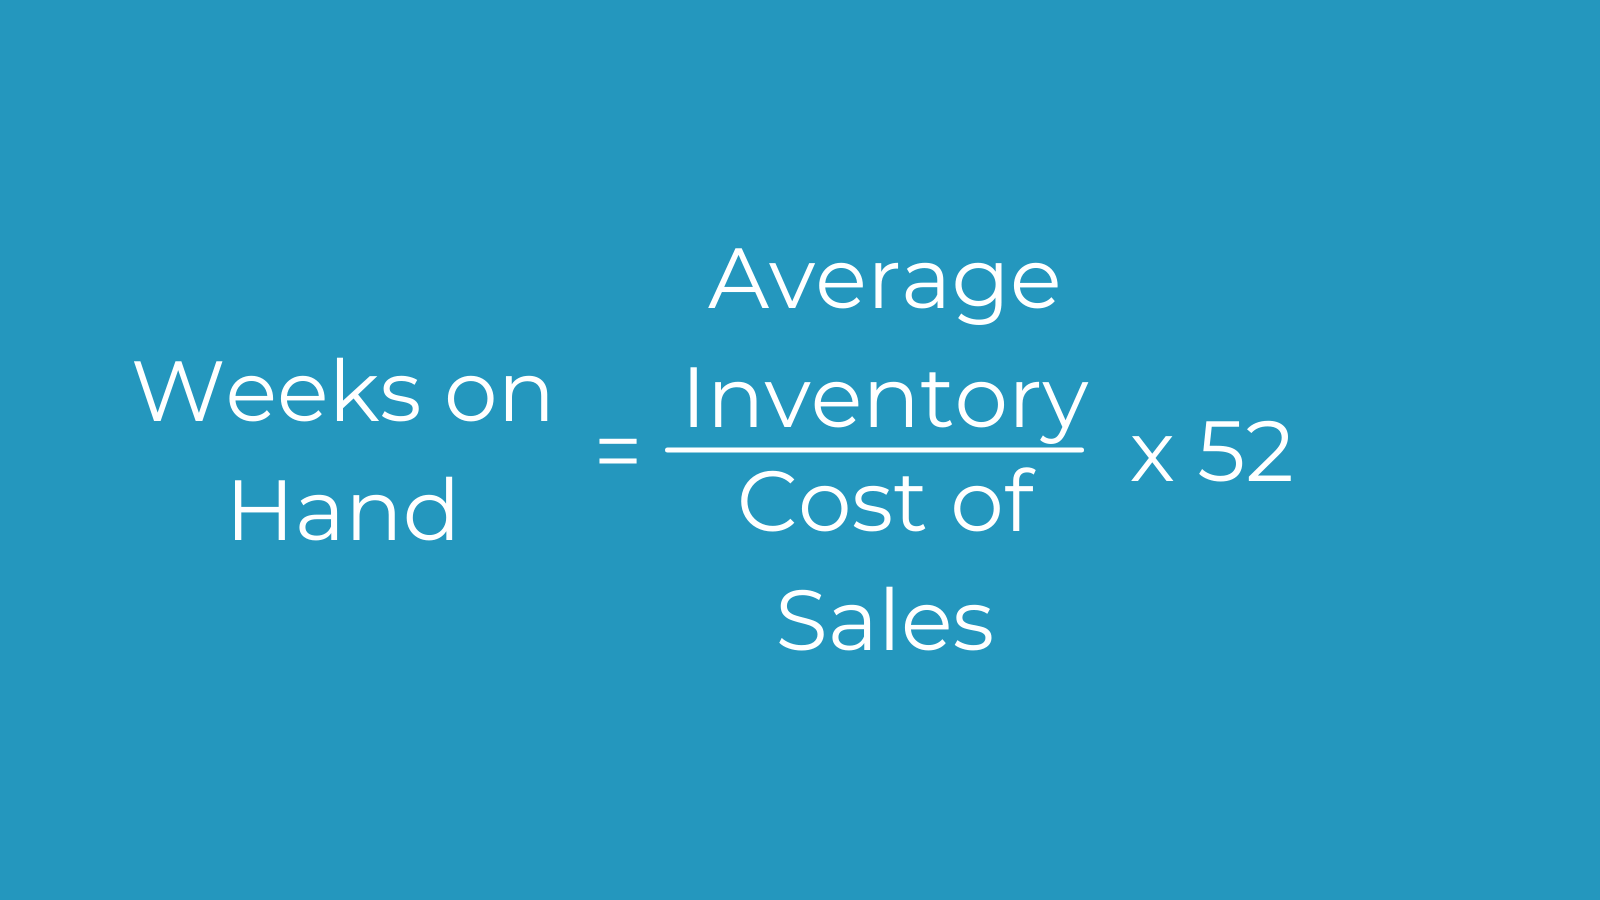
Weeks on Hand
Weeks on hand = (average inventory for period / cost of sales for period) x 52
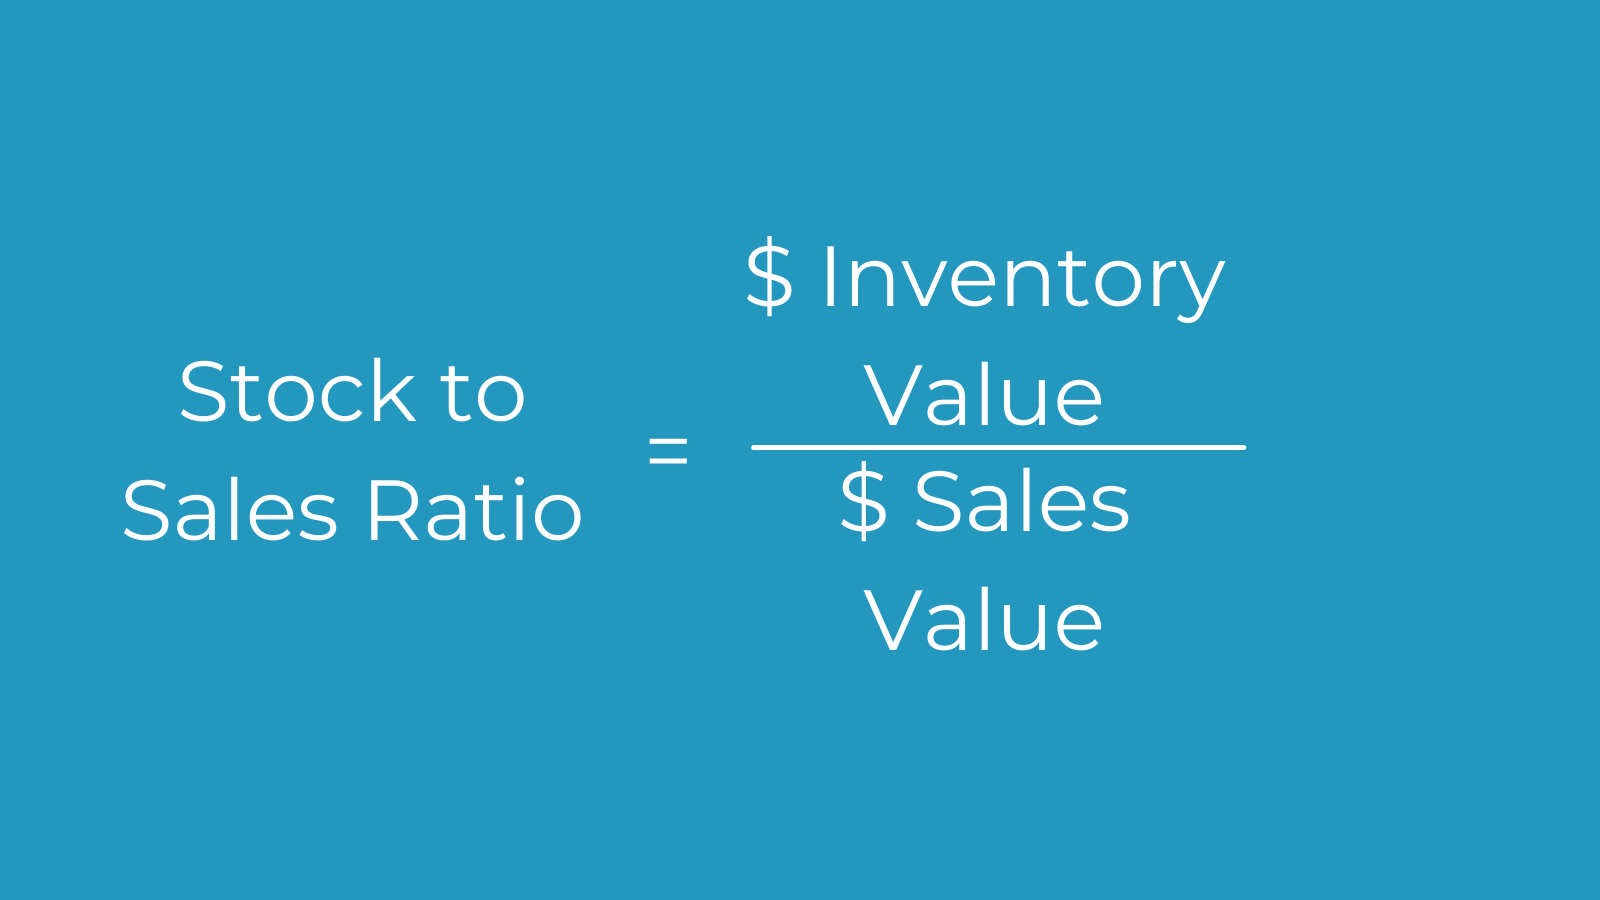
Stock to Sales Ratio
Stock to sales ratio = $ inventory value / $ sales value
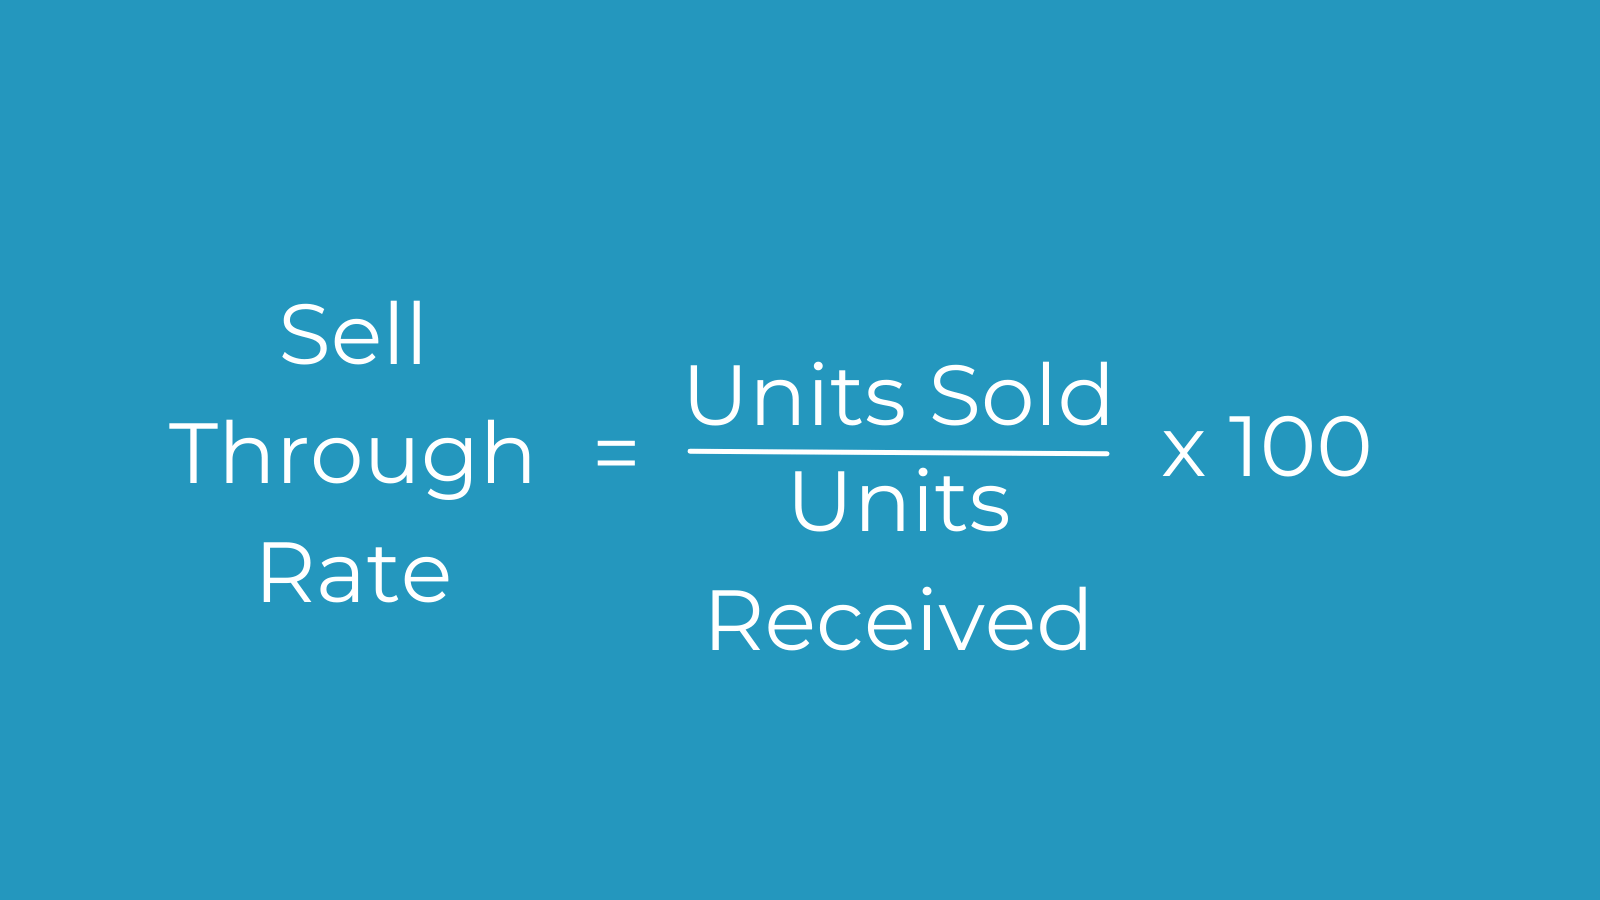
Sell-through Rate
Sell-through rate = (# units sold / # units received) x 100
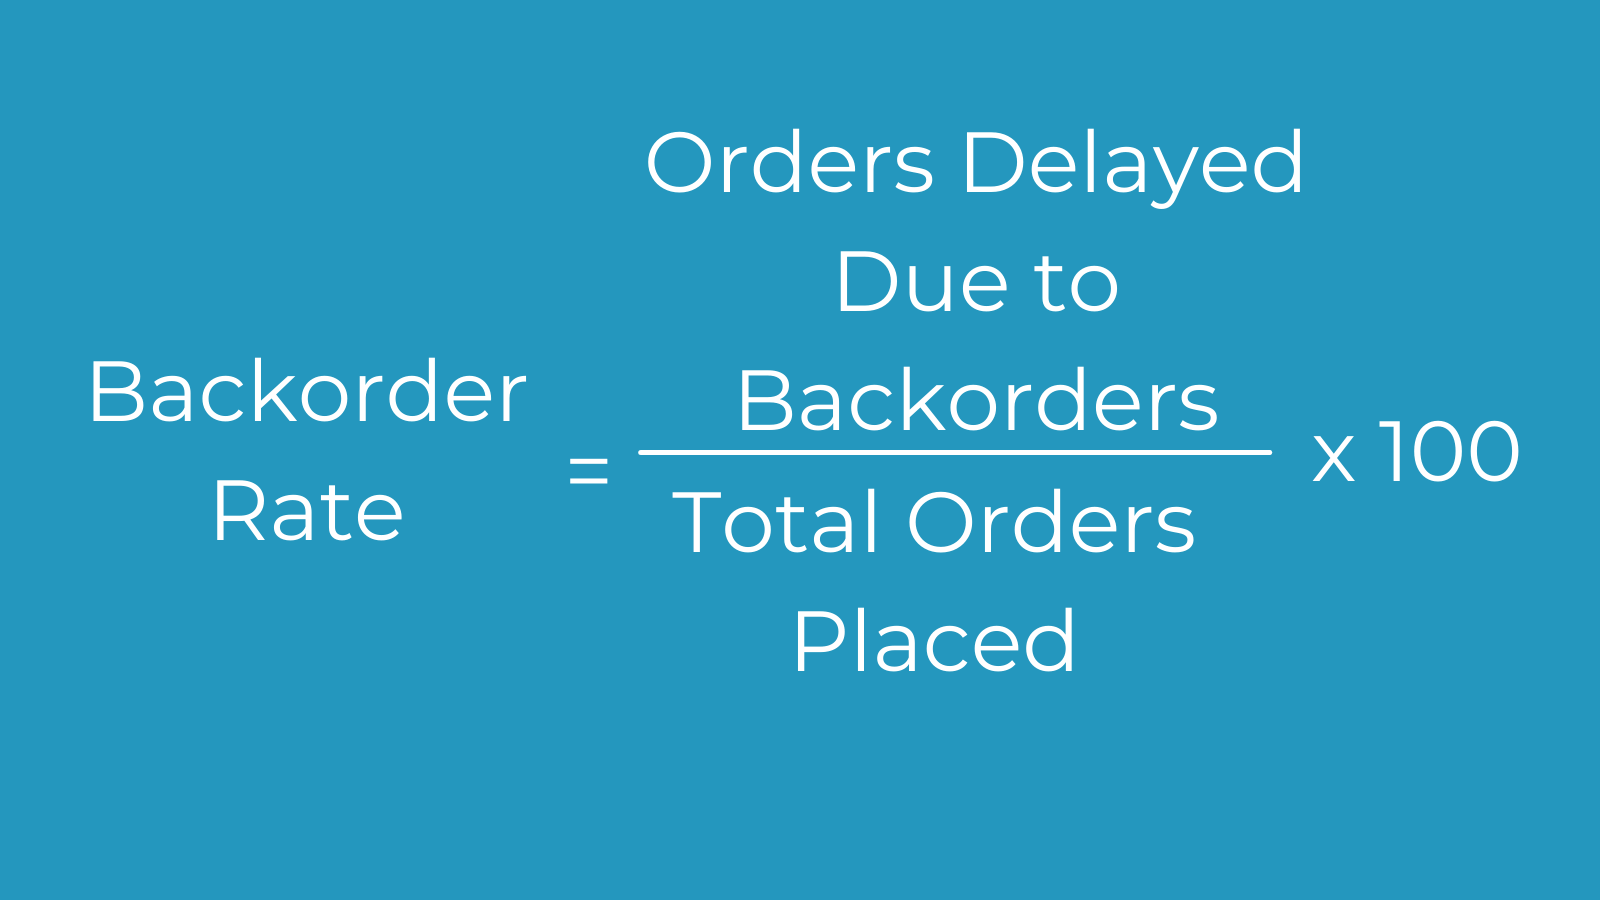
Backorder Rate
Backorder Rate = (# delayed orders due to backorders / total # orders placed) x 100
Accuracy of Forecast Demand
Accuracy of Forecast Demand = [(actual – forecast) / actual] x 100
Rate of Return
Rate of return (ROR) = [(final value – initial value) / initial value] x 100
Where
FV = Final Value
IV = Initial Value
Product Sales
Product sales = gross sales revenue – sales returns – discounts – allowances
Where
GSR = Gross Sales Revenue
SR = Sales Returns
Revenue Per Unit
Revenue per unit = total revenue per period / average units sold per period
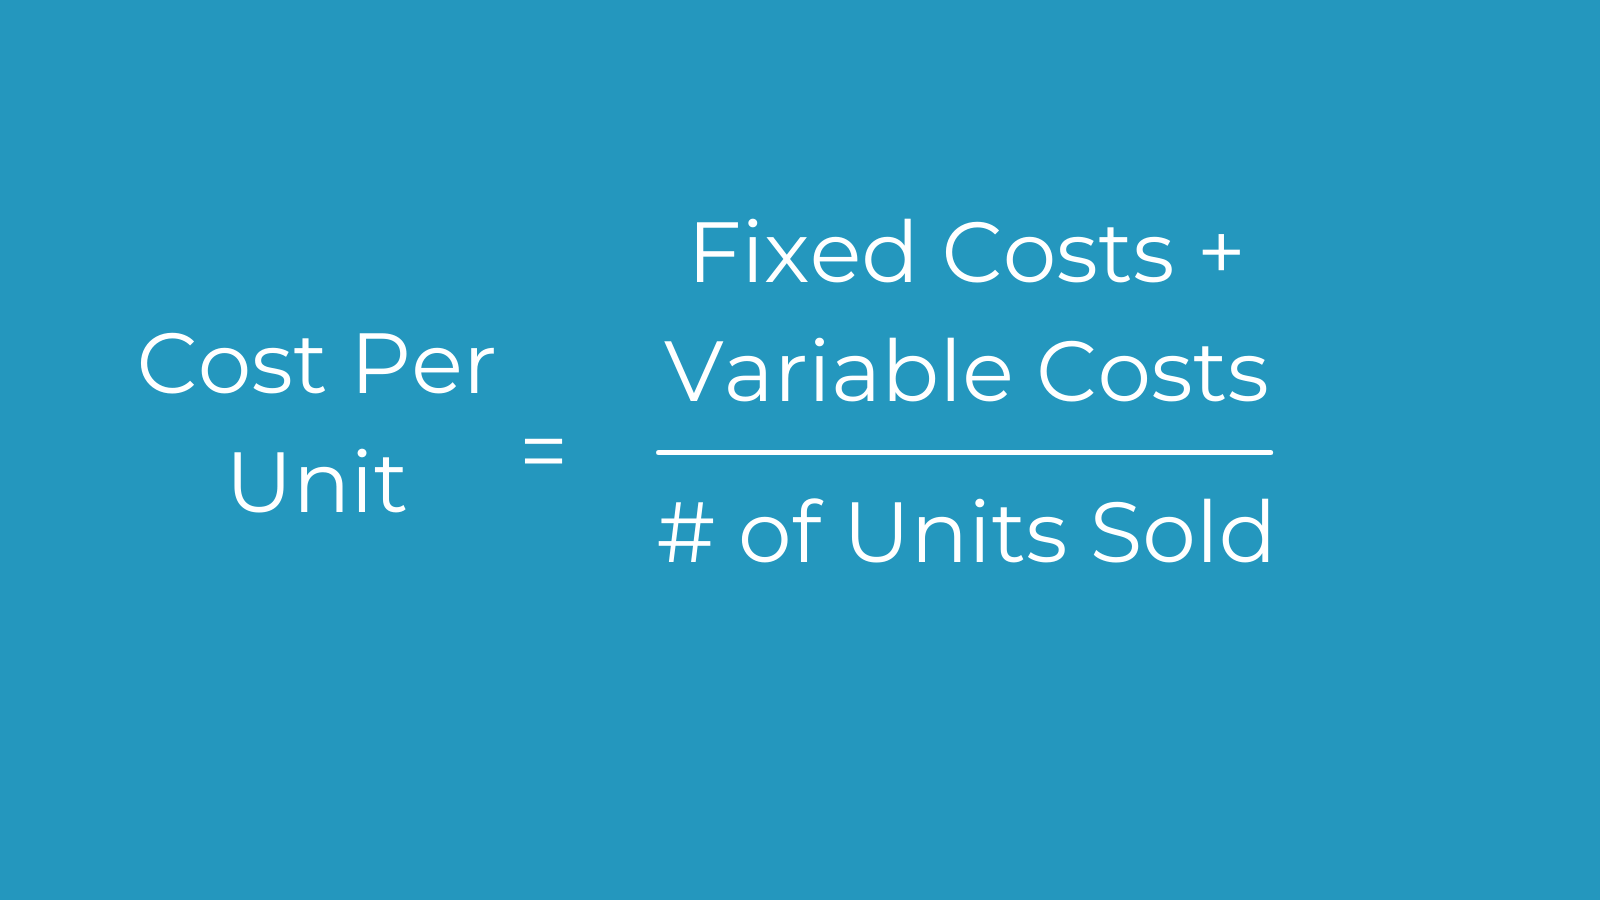
Cost Per Unit
Cost per unit = (fixed costs + variable costs )/ # units produced
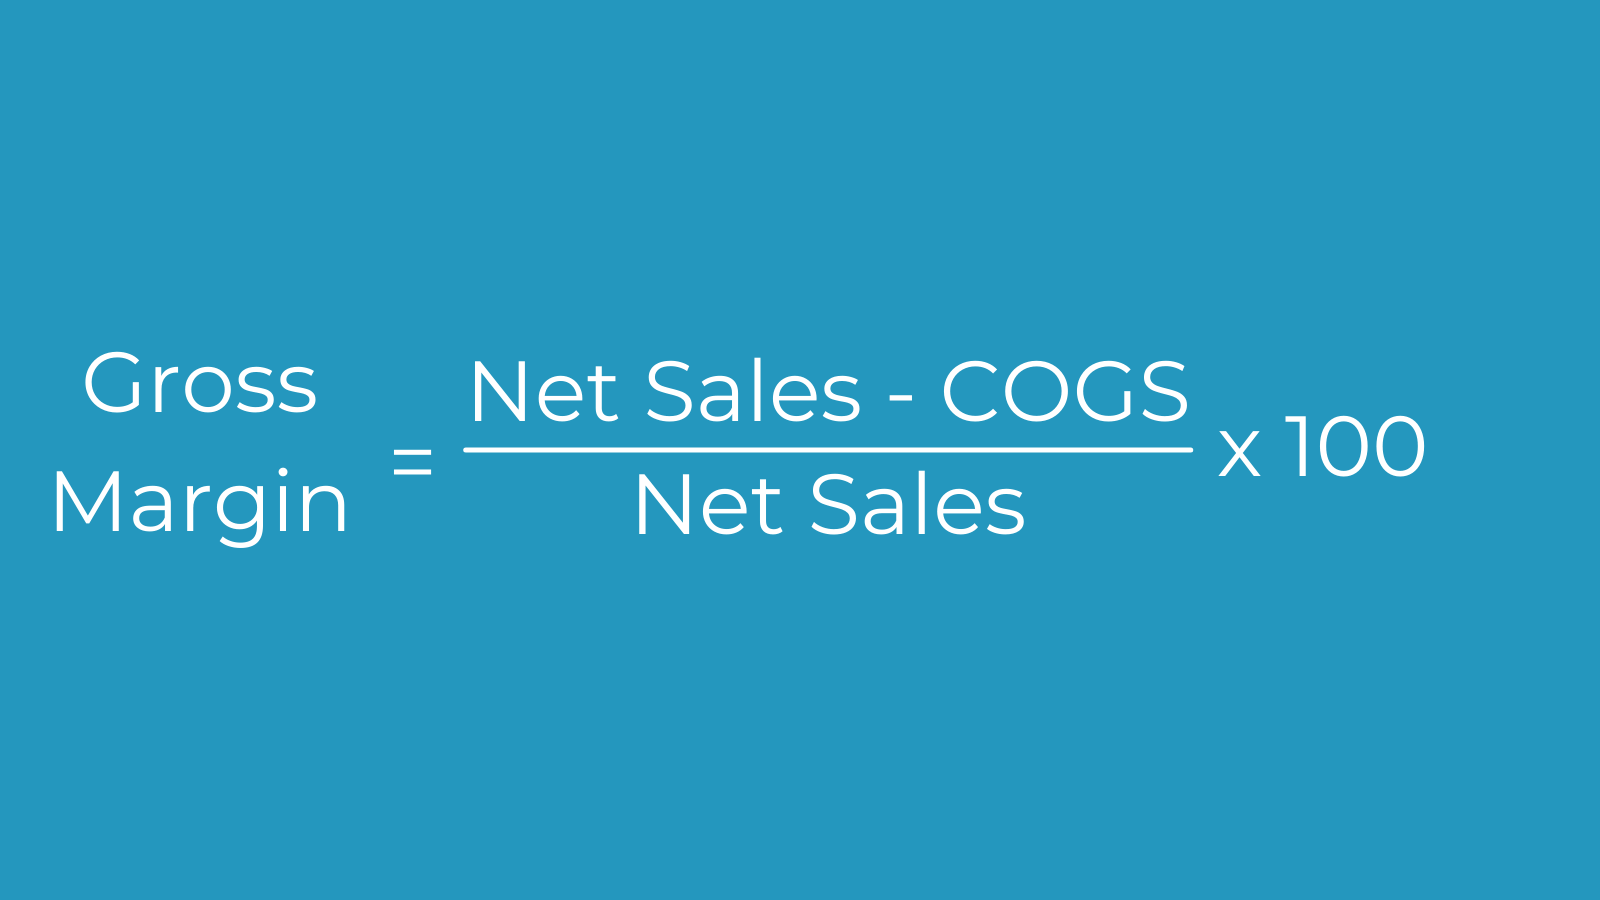
Gross Margin by Product
Gross margin = [(net sales – cost of goods sold) / net sales] x 100
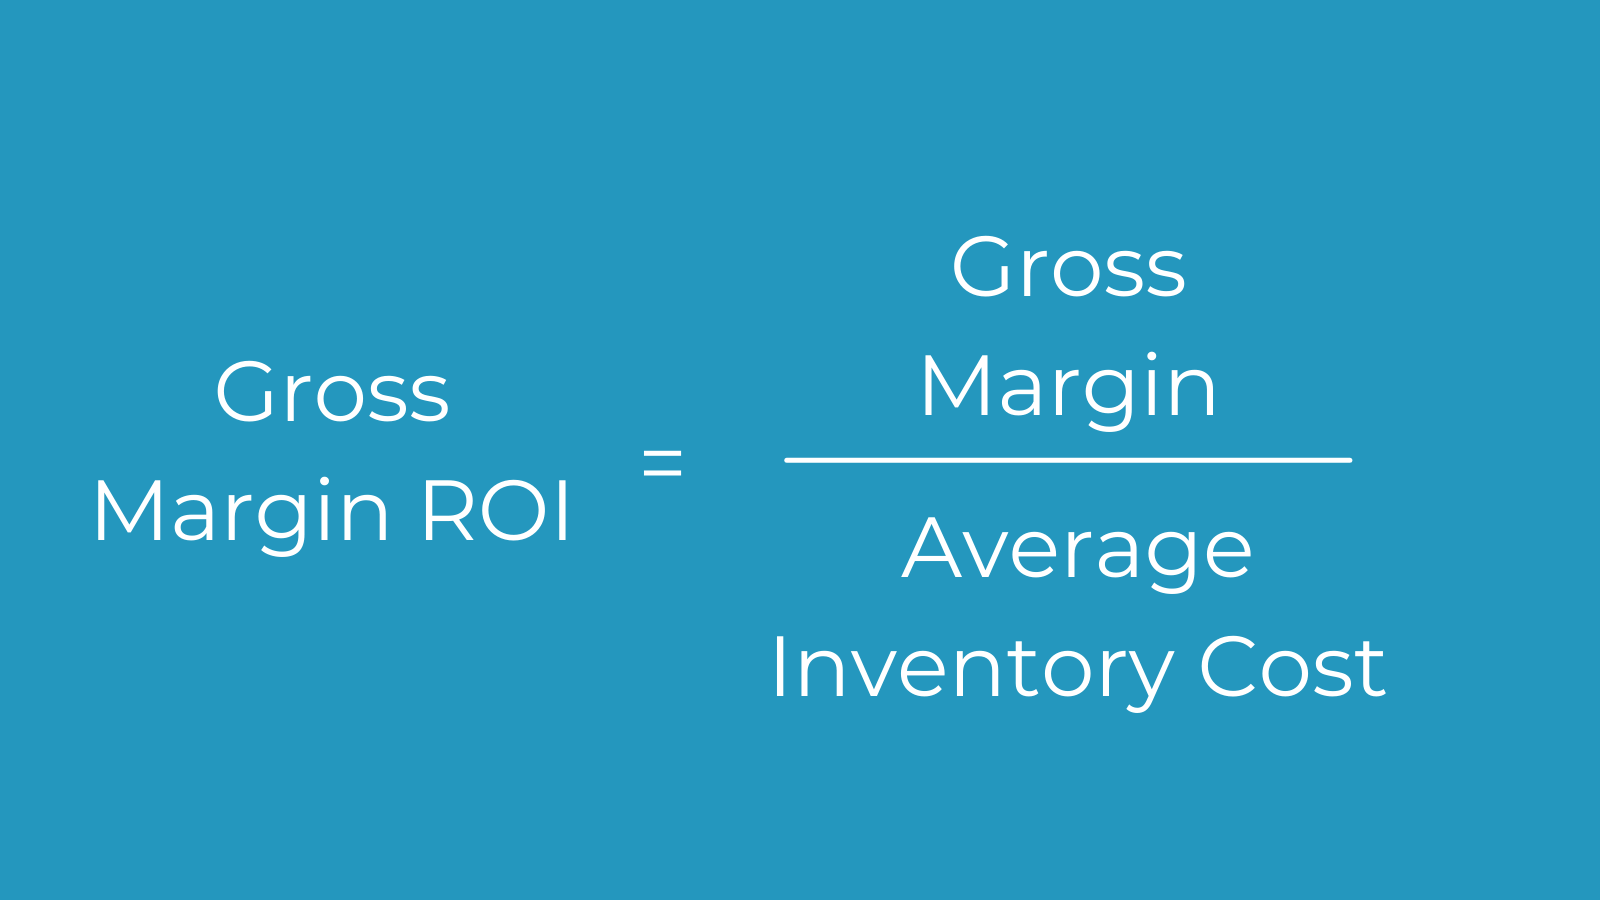
Gross Margin Return on Investment
Gross margin return on investment = gross margin / average inventory cost
Receiving KPIs
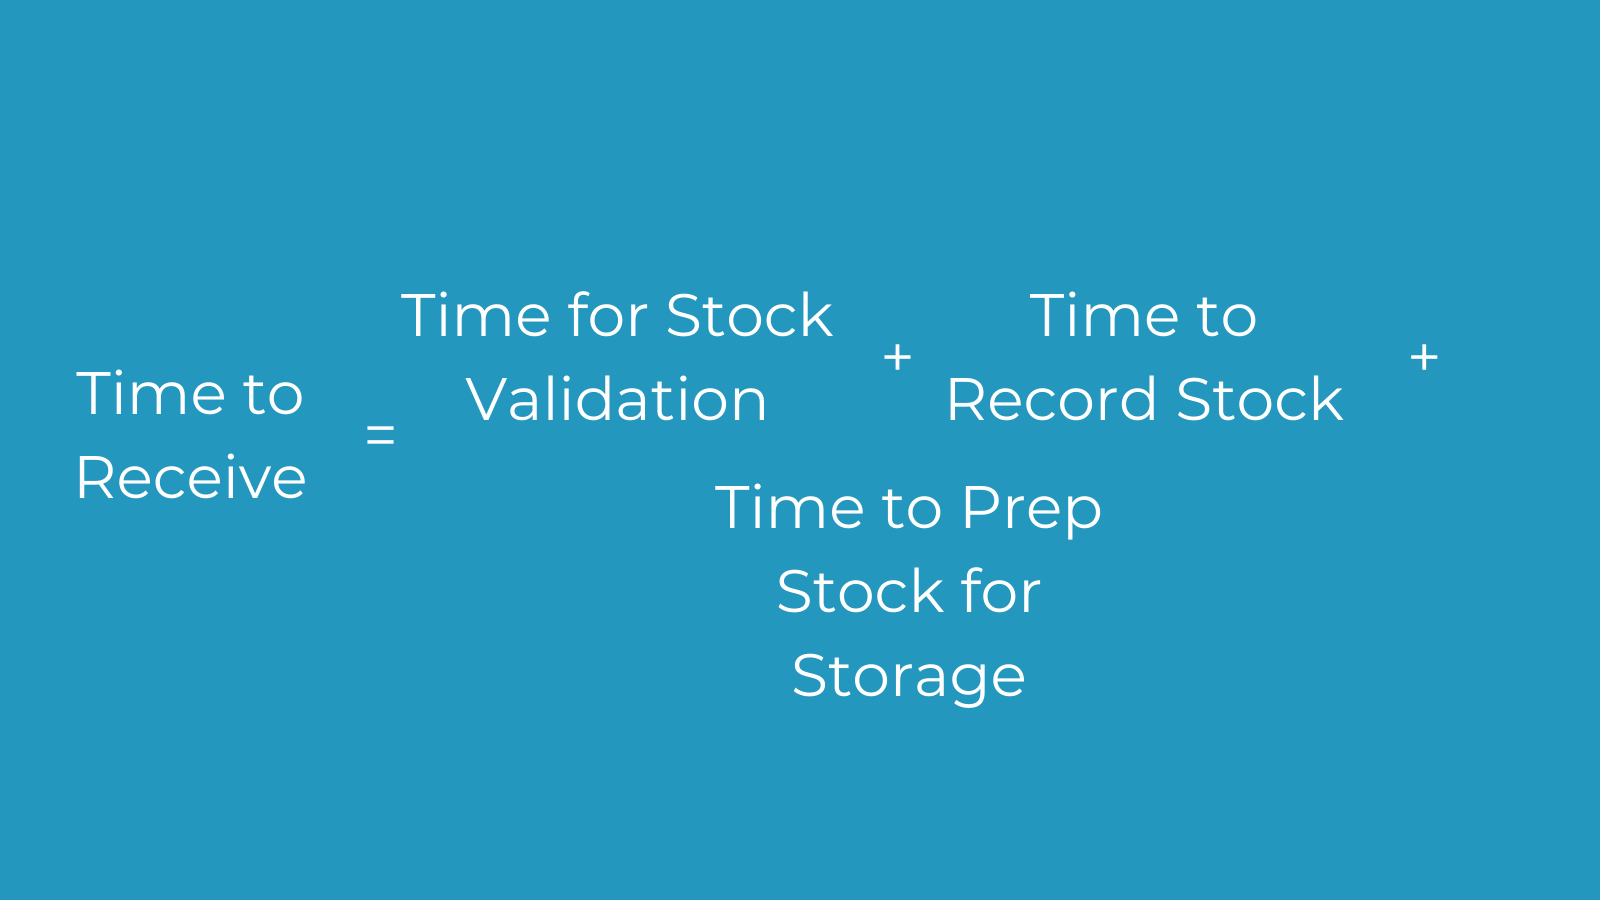
Time to Receive
Time to receive = time for stock validation + time to add stock to records + time to prep stock for storage
Put Away Time
Put away time = total time to stow received stock
Supplier Quality Index
Supplier quality index = (material quality x 45%) + (corrective action x 10%) + (prompt reply x 10%) + (delivery quality x 20%) + (quality systems x 5%) + (commercial posture x 10%)
Operational KPIs
Lost Sales Ratio
Lost sales ratio = (# days product is out of stock / 365) x 100
.png?width=1600&name=Lost%20Sales%20Ratio%20(1).png)
Perfect Order Rate
Perfect order rate = [(# orders delivered on time / # orders) x (# orders complete / # orders) x (# orders damage free / # orders) x (# orders with accurate documentation / # orders)] x 100
Inventory Shrinkage
Inventory shrinkage = ending inventory value – physically counted inventory value
Average Inventory
Average inventory = (beginning inventory + ending inventory) / 2
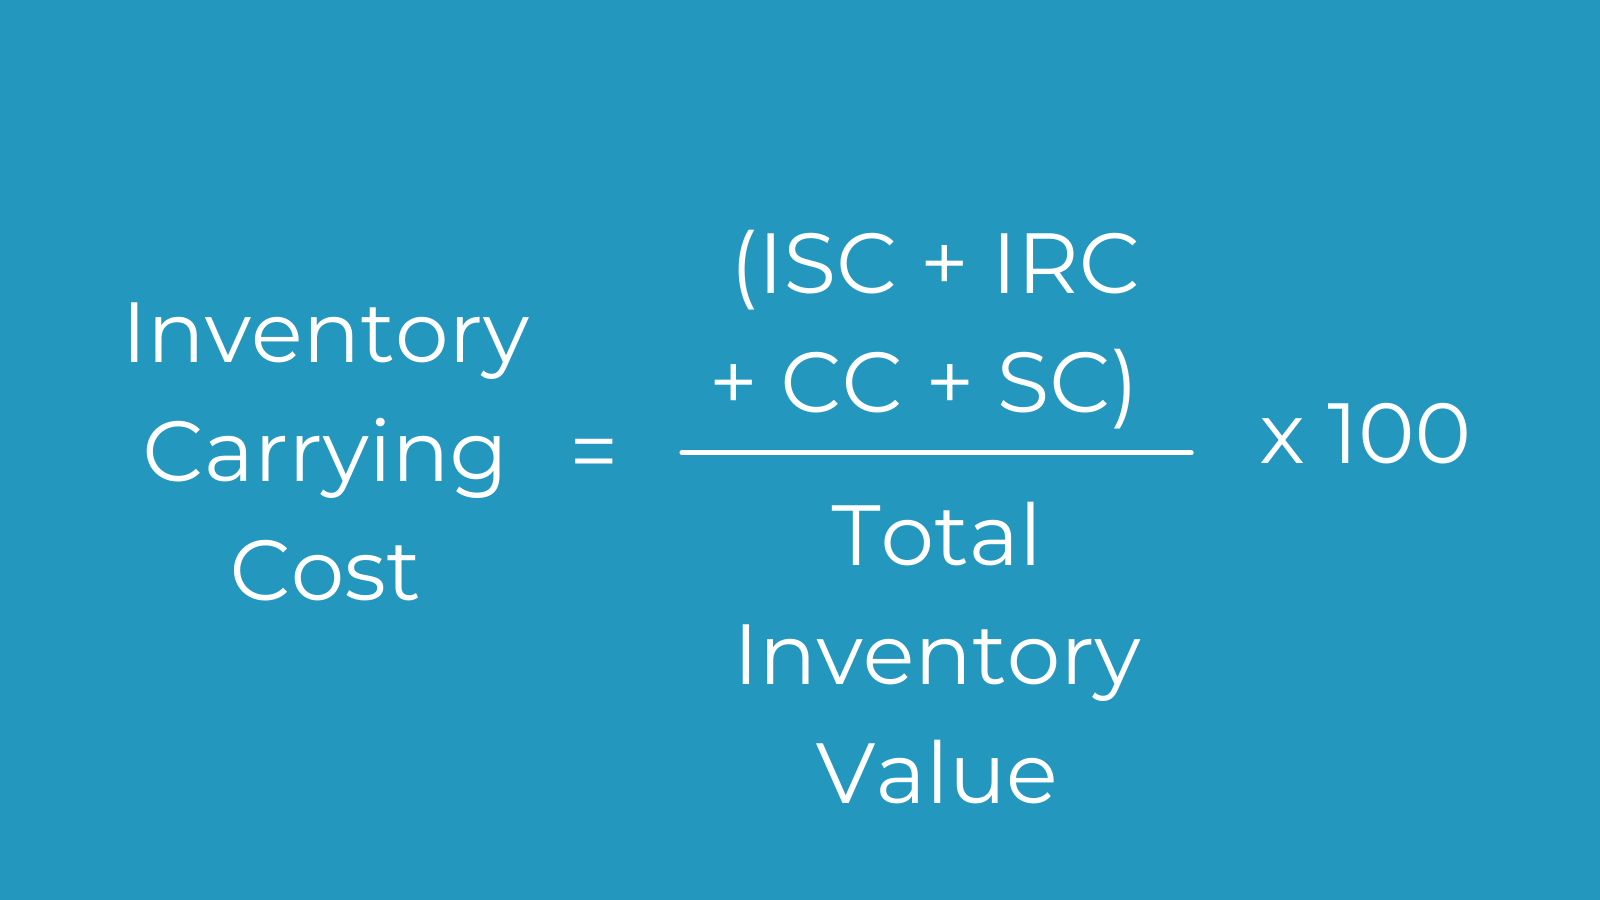
Inventory Carrying Cost
Inventory carrying costs = [(inventory service costs + inventory risk costs + capital cost + storage cost) / total inventory value] x 100
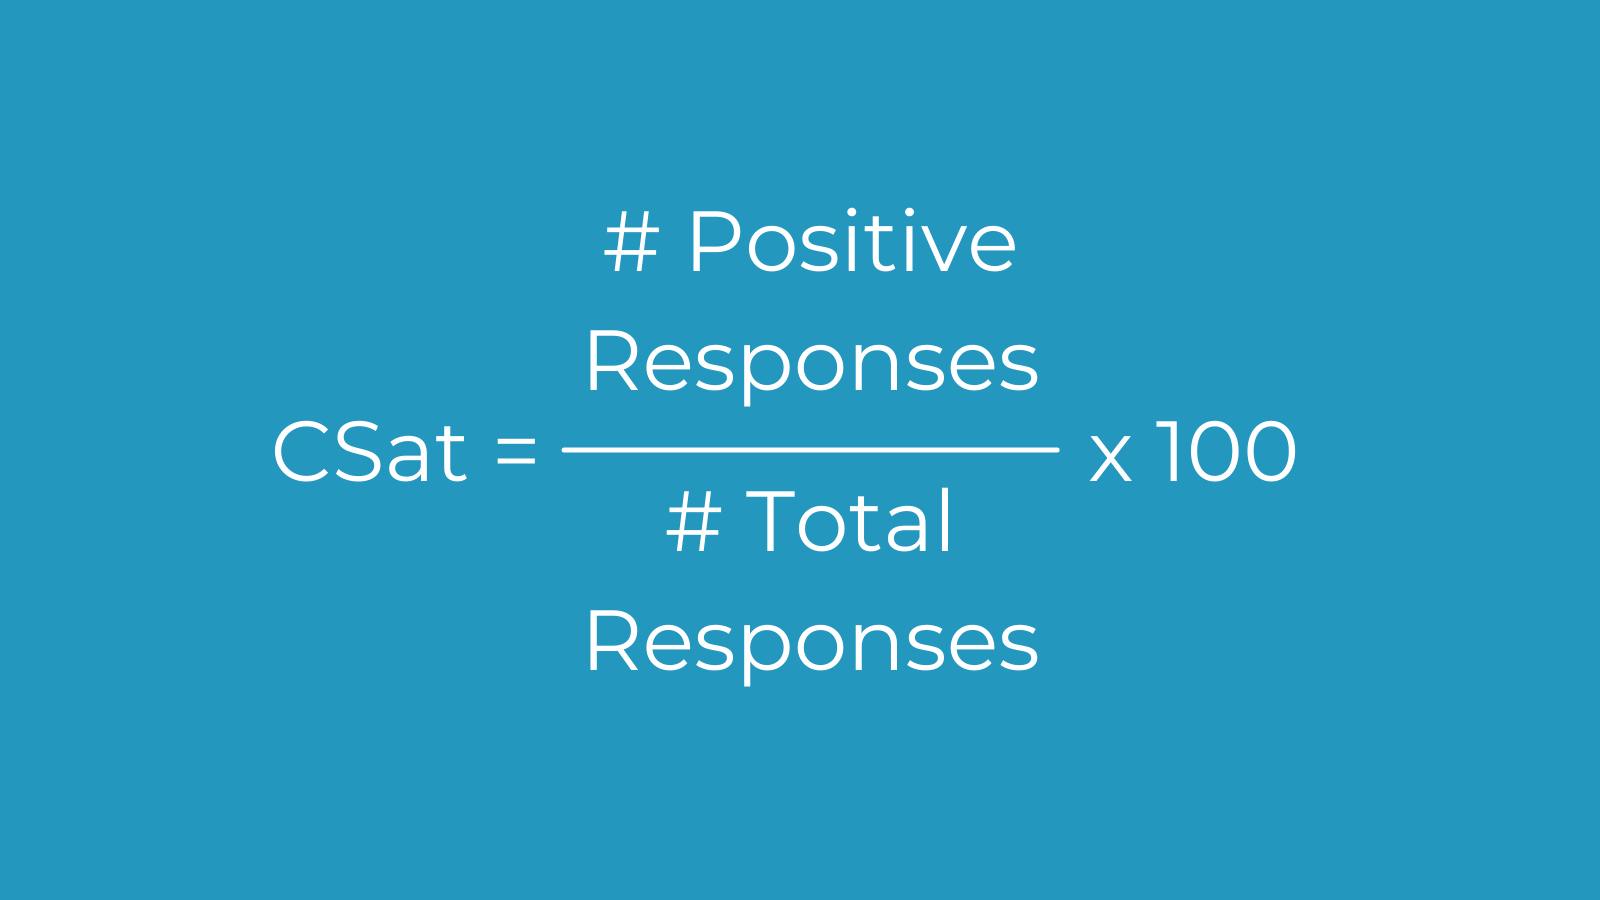
Customer Satisfaction Score (CSat)
CSat= (# positive responses / # total responses) x 100
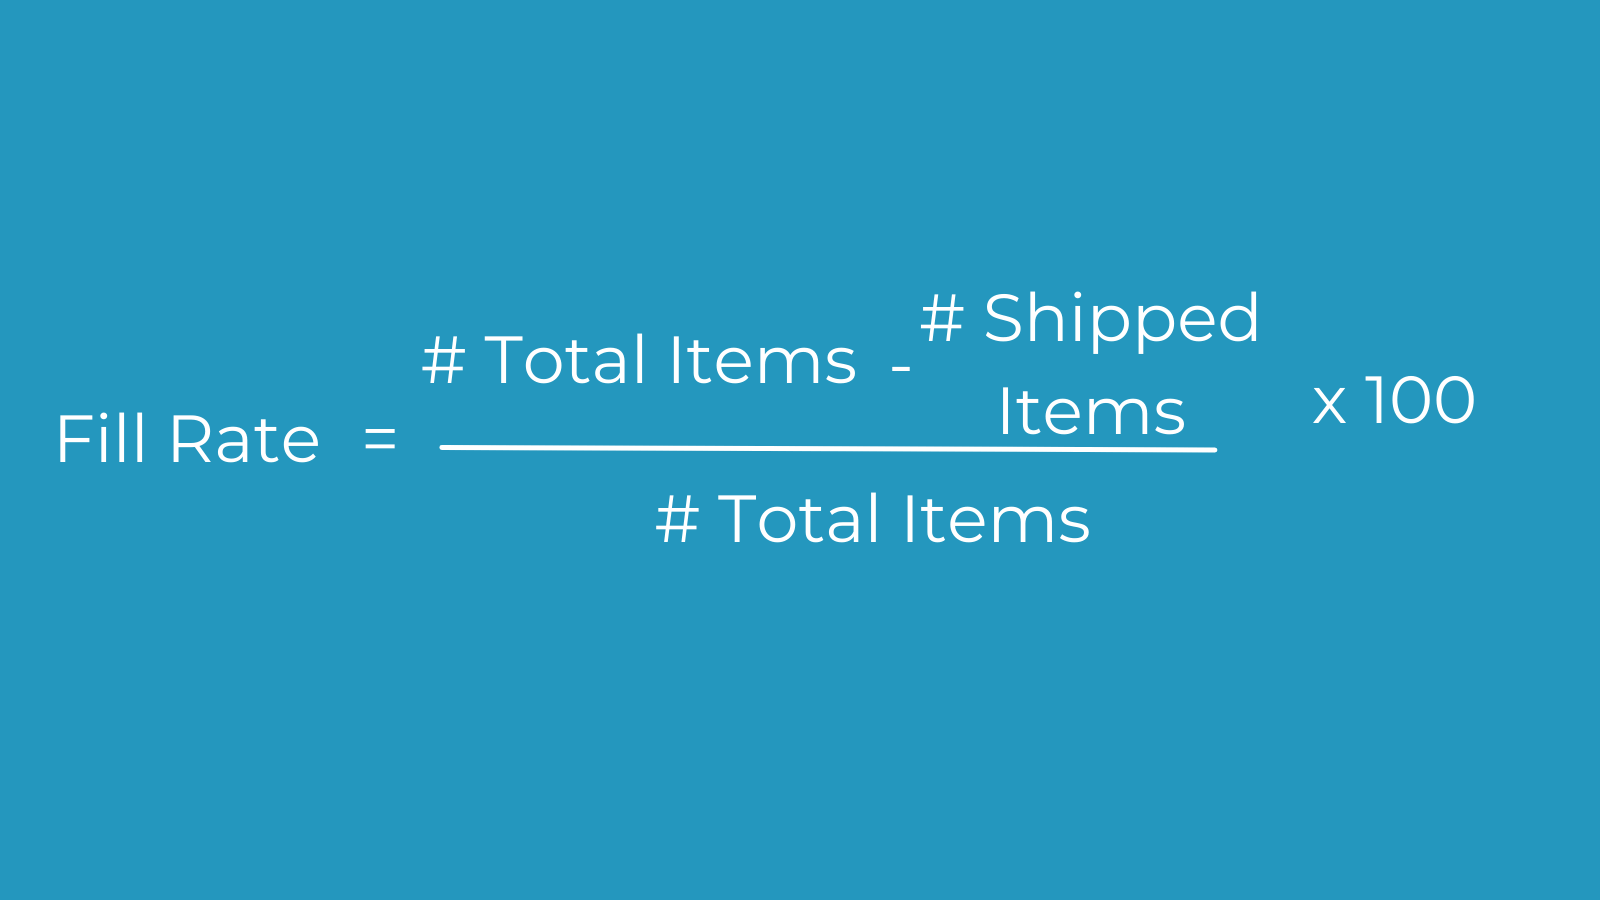
Fill Rate
Fill rate = [(# total items – # shipped items) / # total items] x 100
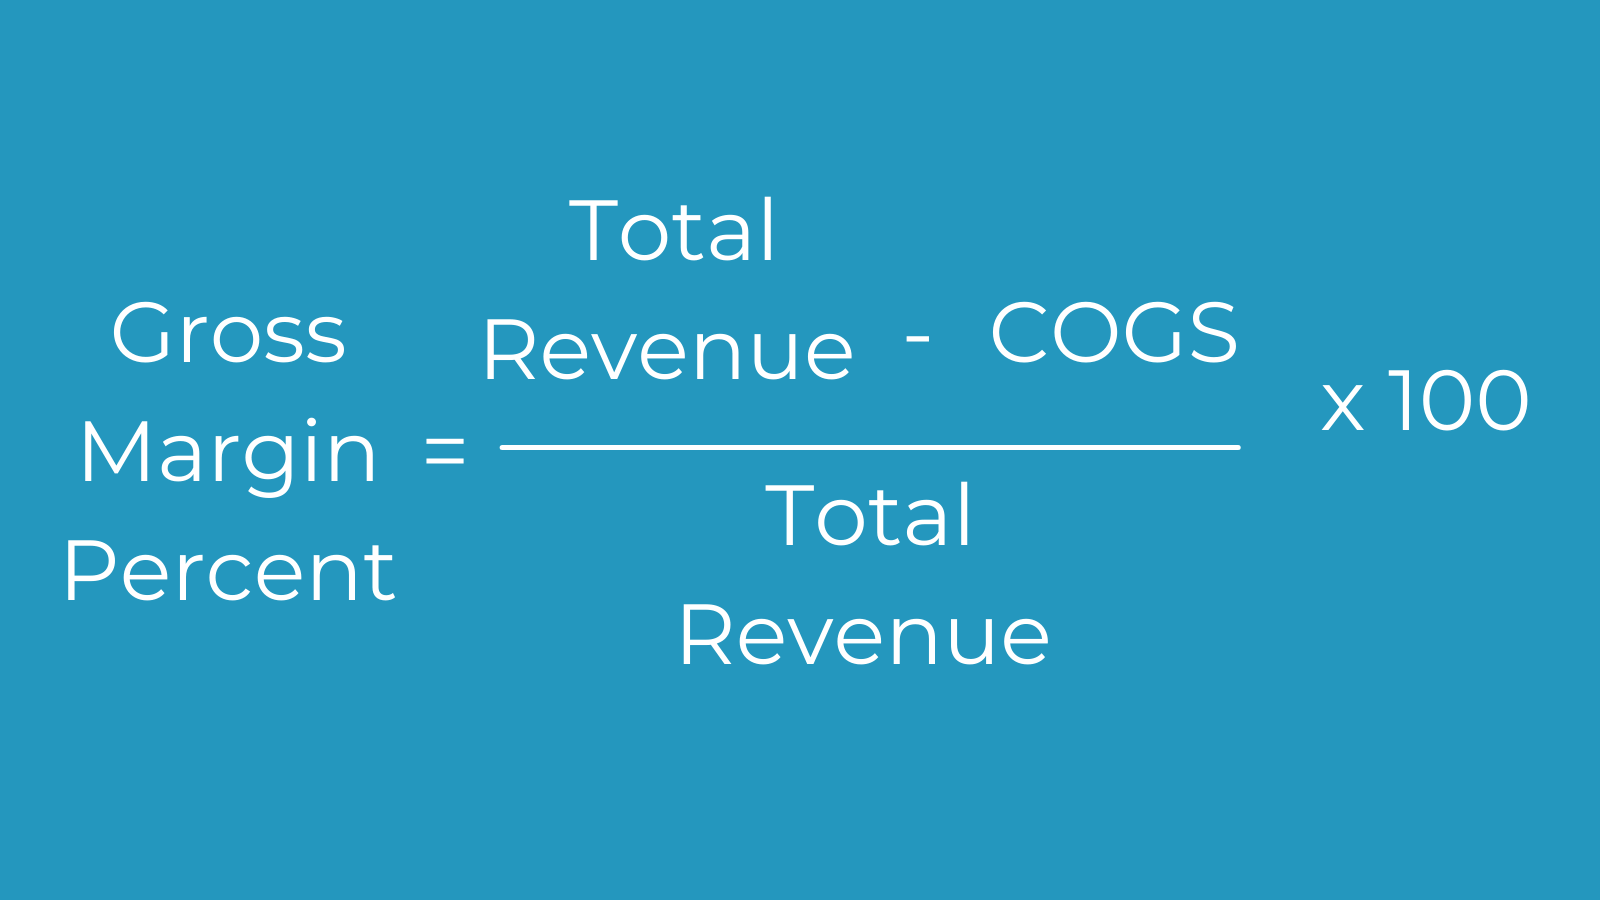
Gross Margin Percent
Gross margin percent = [(total revenue – cost of goods sold) / total revenue] x 100
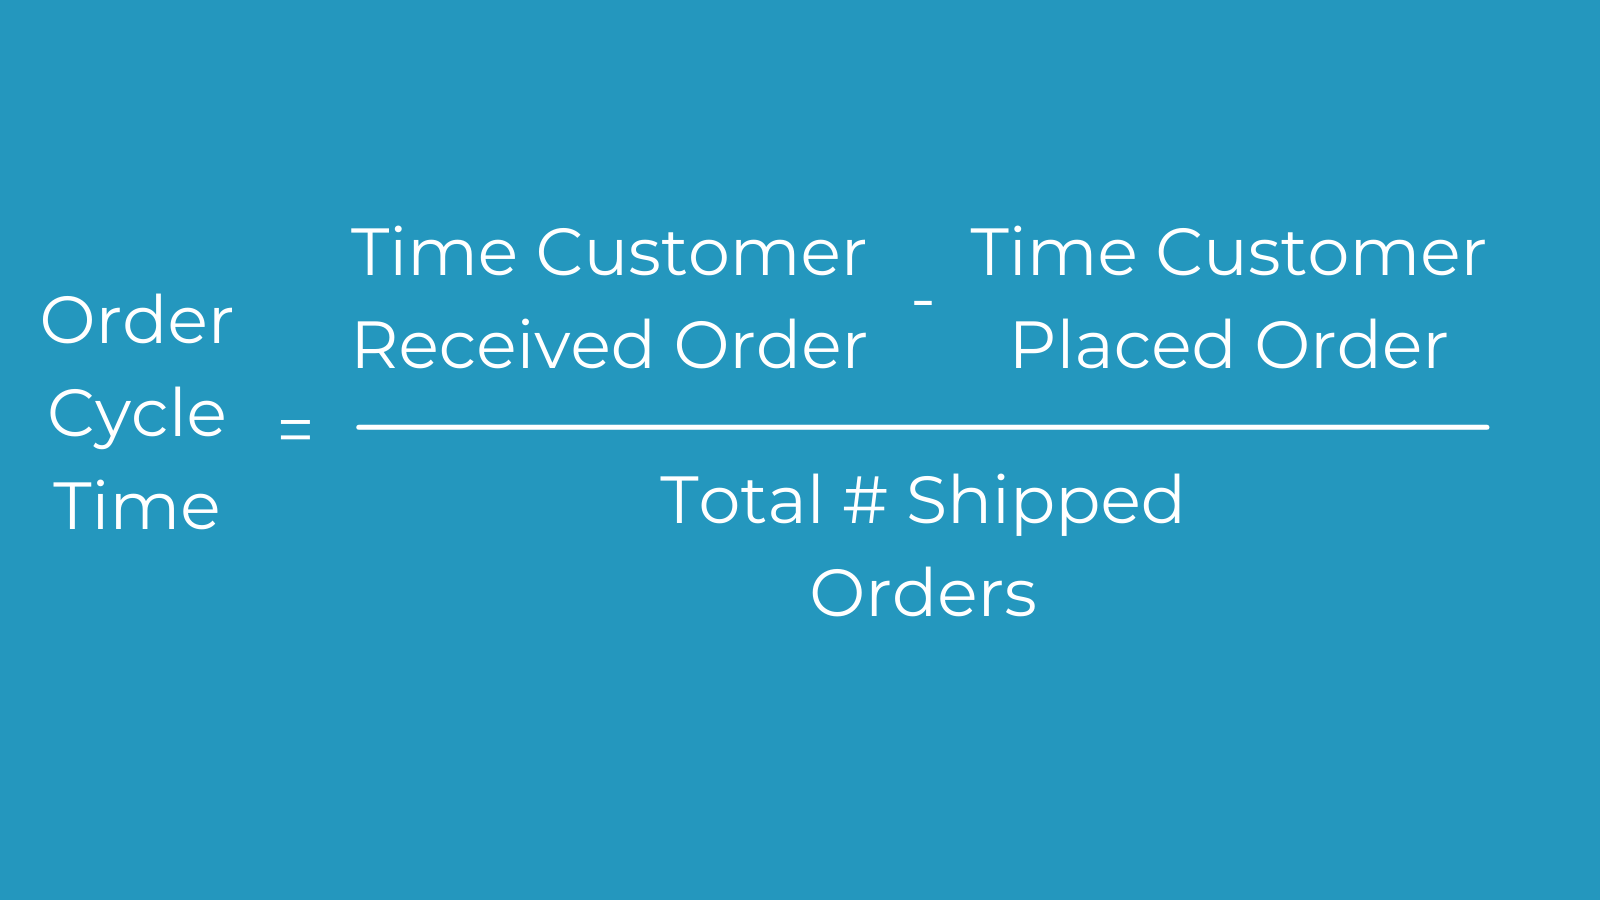
Order Cycle Time
Order cycle time = (time customer received order – time customer placed order) / # total shipped orders
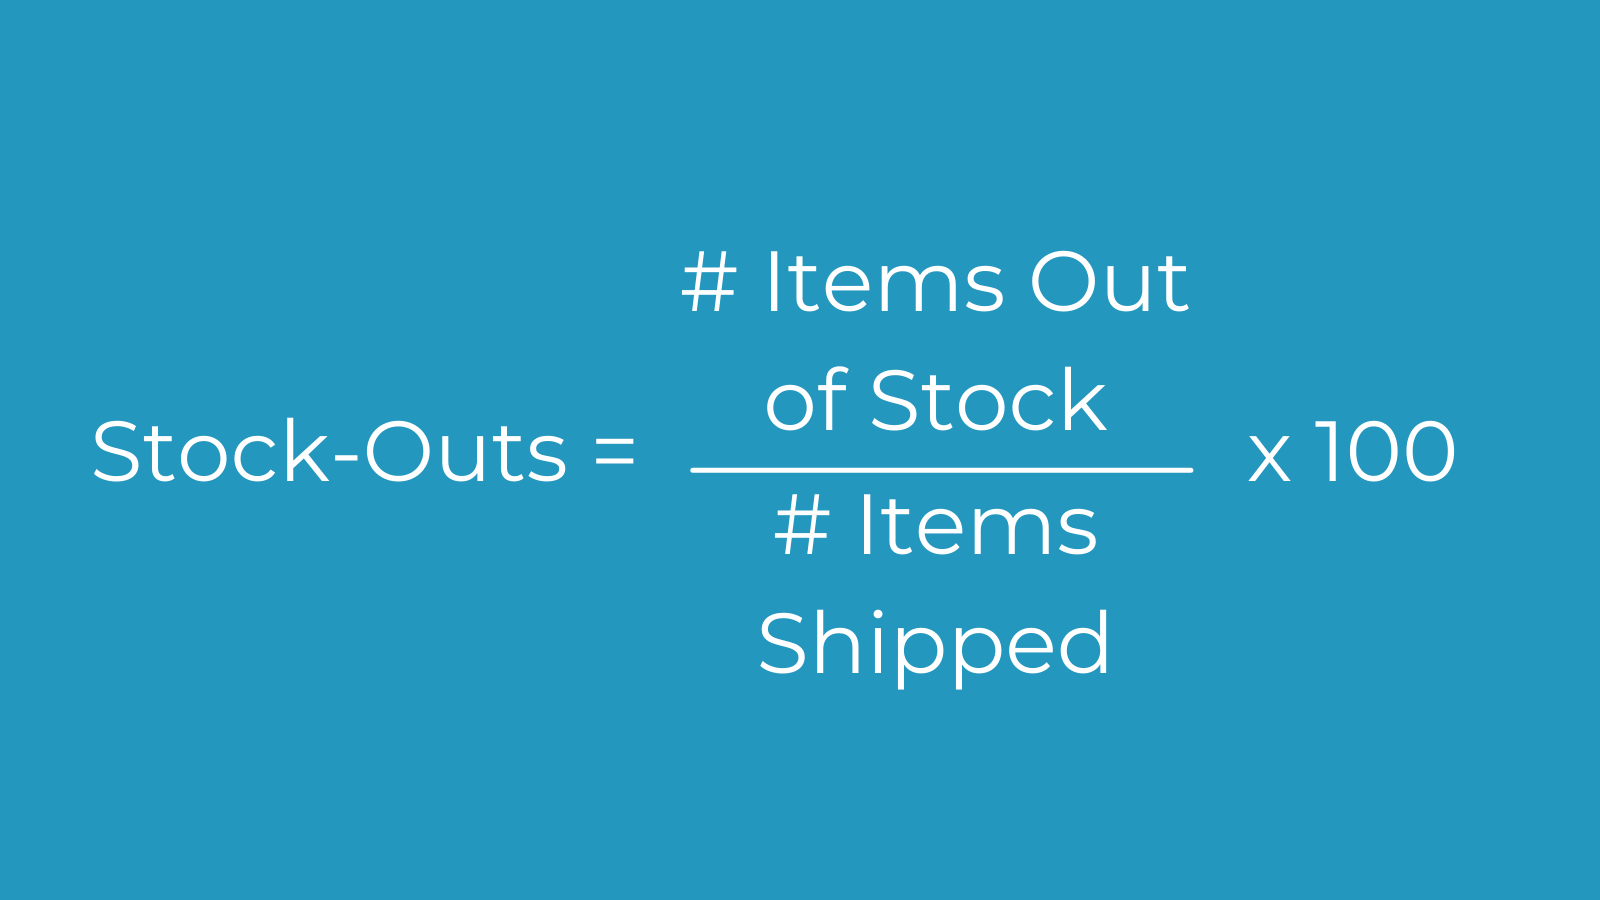
Stock-Outs
Stock-outs = (# items out of stock / # items shipped) x 100
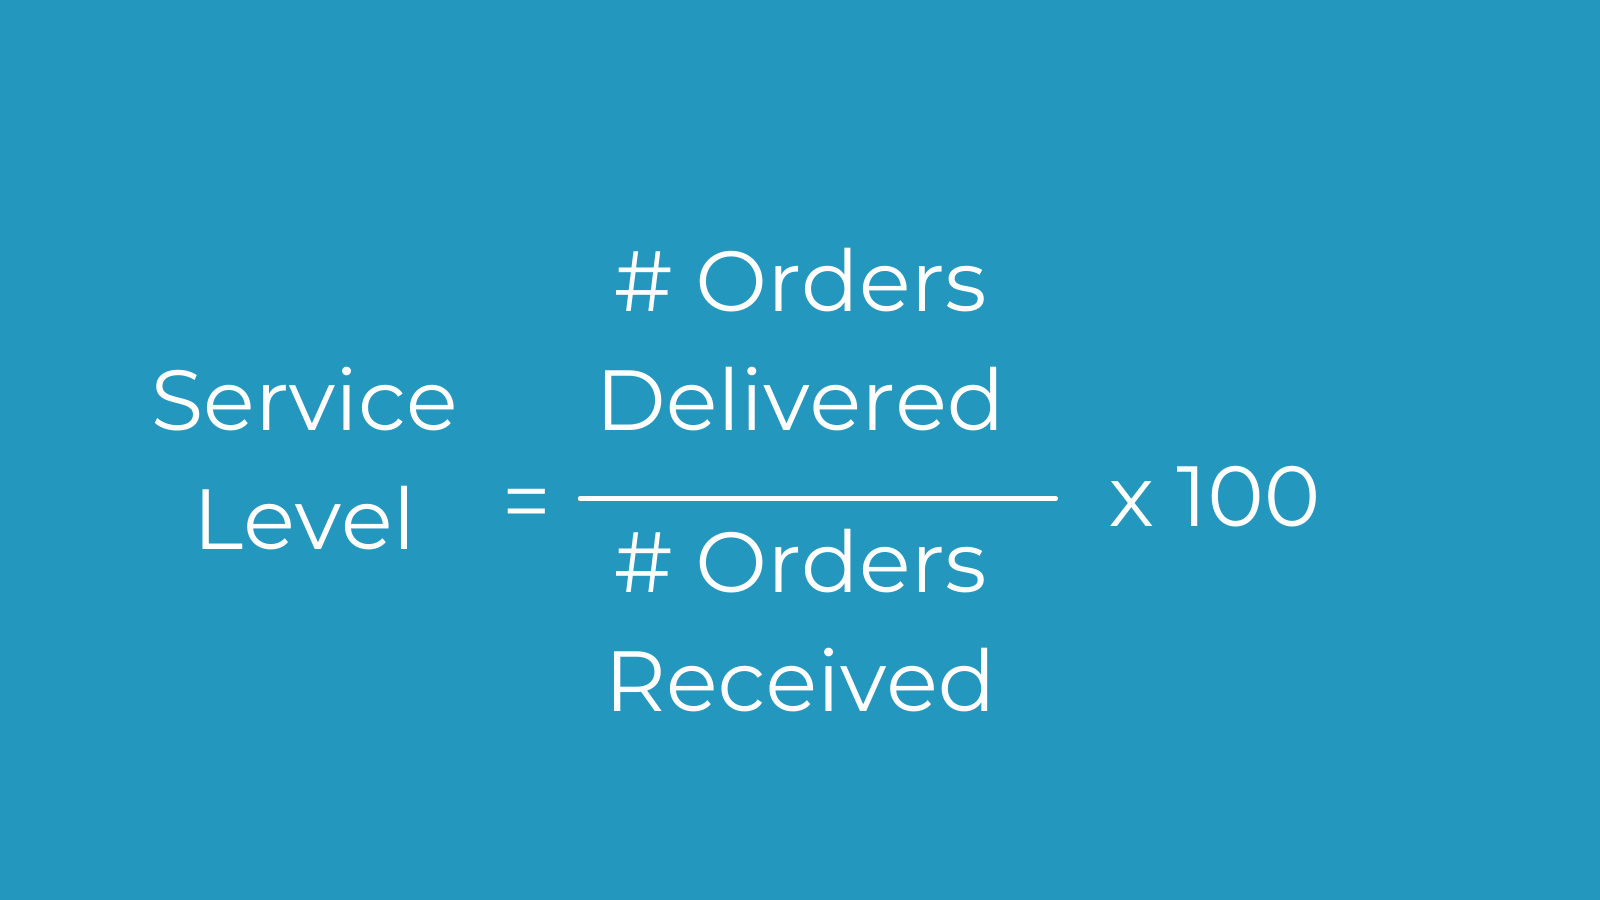
Service Level
Service level = (# orders delivered / # orders received) x 100
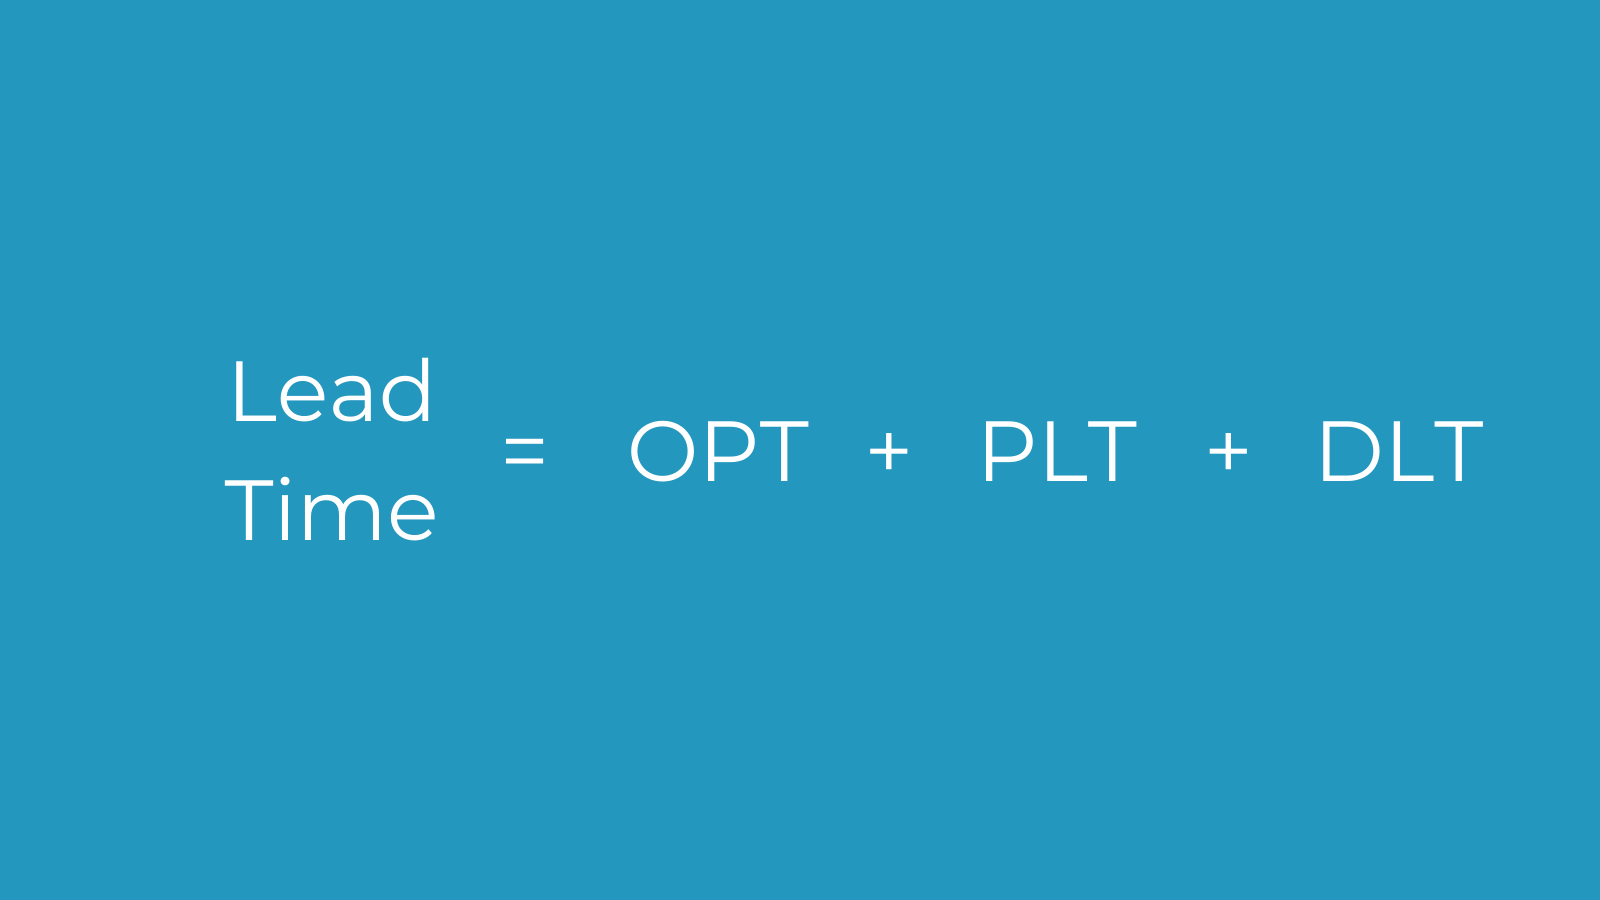
Lead Time
The time it takes a supplier to deliver goods after an order is placed and the timeframe for reordering.
Lead time = order process time + production lead time + delivery lead time
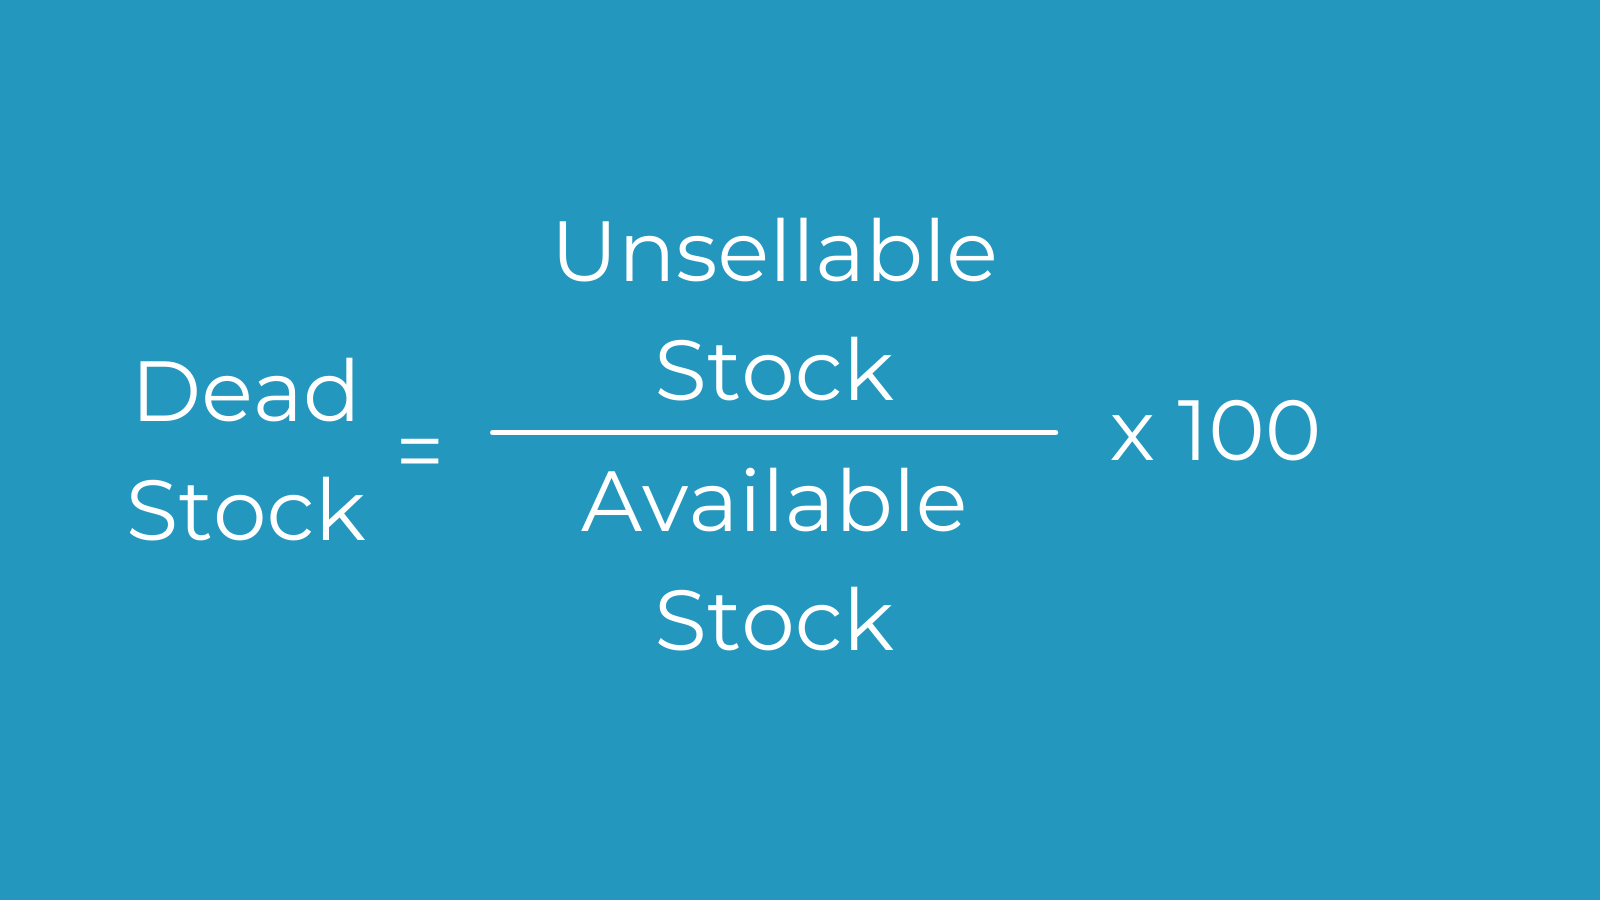
Dead Stock/Spoilage
Items that have never been sold to or used by a customer, typically because they’re outdated.
Dead/spoiled stock = (amount of unsellable stock in period / amount of available stock in period) x 100
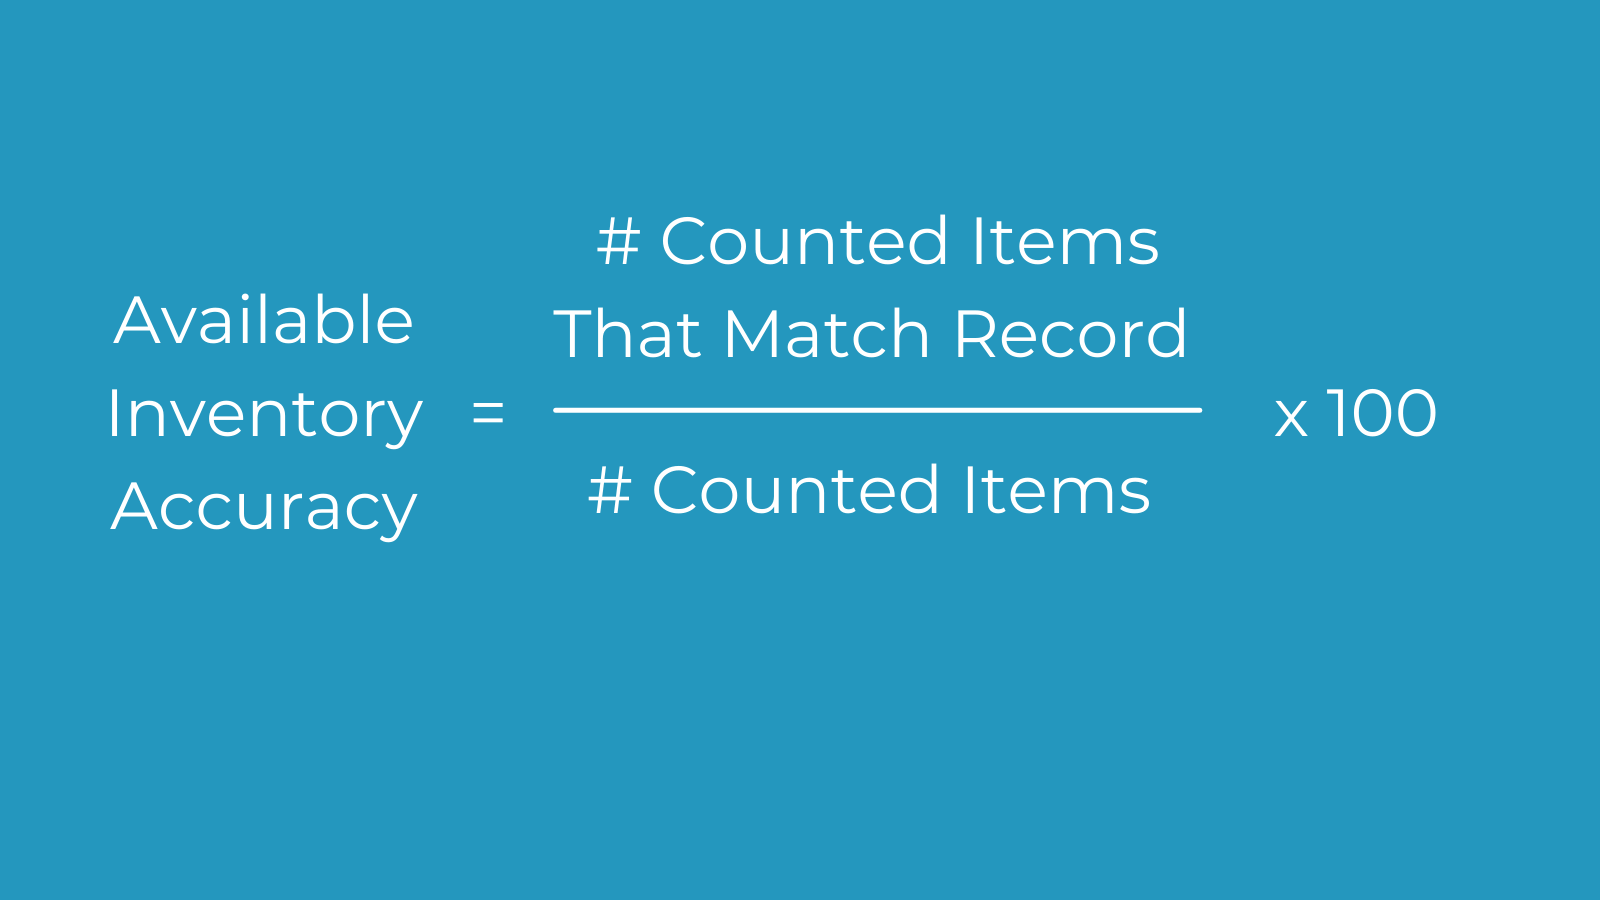
Available Inventory Accuracy
Available inventory accuracy = (# counted items that match record / # counted items) x 100
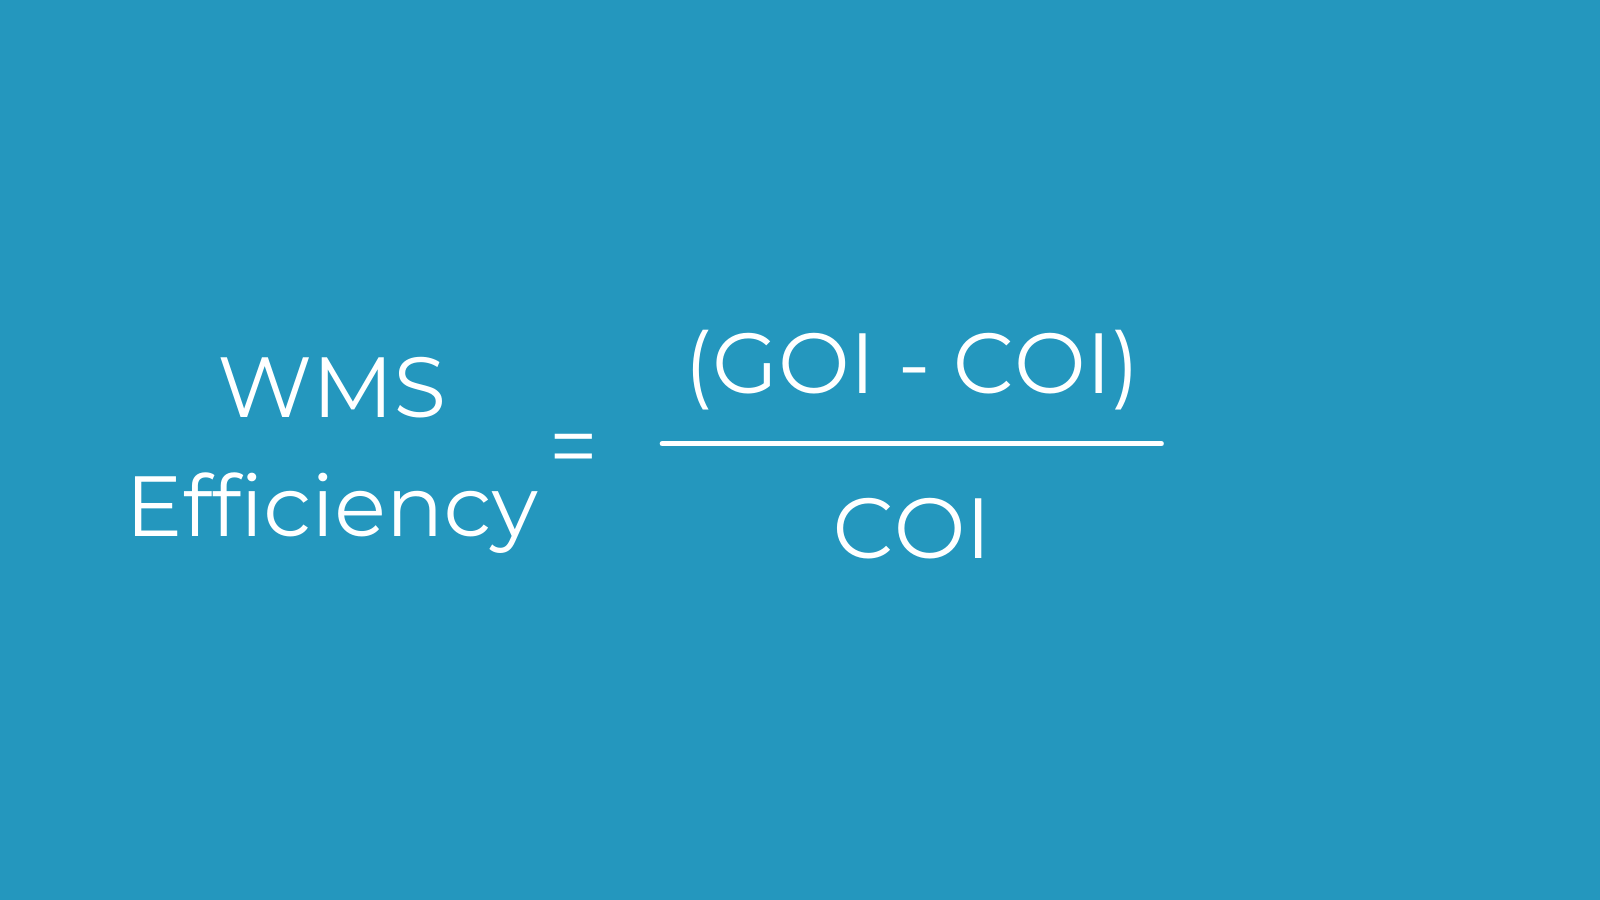
Internal Warehouse Management System (WMS) Efficiency
Internal WMS efficiency (ROI) = (gain on investment – cost of investment) / cost of investment
Employee KPIs
Labor Cost Per Item
Labor cost per item = # total units / total labor expense
.png?width=1600&name=Labor%20Cost%20Per%20Item%20Graphic%20(1).png)
Labor Cost Per Hour
Labor cost per hour = (employee annual gross salary / # weeks employee works in a year) / # hours an employee works in a week
.png?width=1600&name=Labor%20Cost%20Per%20Hour%20(1).png)
How to Choose an Inventory Management System
There are a variety of inventory management systems and apps. How do you choose the right one for your business? First, choose a type of inventory management system:
- Manual Inventory System
- Periodic Inventory System
- Perpetual Inventory System
Then, look for the following features:
- Barcode Scanning
- Real-Time Inventory Updating
- Advanced Reporting
- Support for Multichannel Sales
- Multi-Warehouse Inventory Control
- Inventory Demand Planning & Forecasting
- Accurate Accounting
- Raw Material & Assembly Process Tracking
- Cross-Organizational Integration
- Point of Sale (POS)
Inventory Management Best Practices
Fine-Tune Your Forecasting
A good inventory management system uses automated tools to accurately forecast demand.
Identify Low-Turn Stock
If you have stock that hasn’t sold at all in the last six to 12 months, it’s time to stop stocking that item. You might also consider different strategies for getting rid of that stock. Like a special discount or promotion.
Track your Stock Levels at all Times
Use a system to track your stock level and prioritize the most expensive products. Effective software saves you time and money by doing much of the heavy lifting for you.
.jpg?width=5184&name=stillness-inmotion-d51D3YokZwM-unsplash%20(1).jpg)
Reduce Equipment Repair Times
Essential machinery isn’t always in working order, so it’s important to manage those assets. A broken piece of machinery can be costly. Regularly monitoring your machinery helps you catch problems before they become costly emergencies.
Don’t Forget Quality Control
No matter your specialty, it’s important to ensure that all your products look great and are working well. Have employees check for signs of damage and labeling errors during stock audits.
Automate Everything Your Can
Workflow automation gives you more time to focus on other aspects of your business. No matter how small your company is, inventory management automation has its advantages.
- Customize the storefront experience for both B2C and B2B buyers
- Streamline selling across multiple channels and stock locations
- Set-and-forget your purchasing and order processes
- Automatically track revenue and expansion goals
- Apply bulk actions for high-order volumes
How Sav Can Help
Here at Sav, we’re dedicated to helping small business owners elevate their passion online. That starts with your own beautiful website. No matter what you sell, which supplier you choose, or who your audience is, we make it easy to build and manage your website. Find out how today!

Recommended articles

How to Make a Media Kit
What is a Media Kit? A media kit, also known as a press kit, is a document that businesses give to journalists and media outlets before an...
Read more
What is Brand Voice? [And How to Create One]
What is Brand Voice? A brand voice is the unique personality a brand takes on in all of its communication channels. And it’s not just about...
Read more
A Beginner's Guide to the Product Development Process
What is Product Development? Product development is the process of creating a new product or updating an existing product from idea to...
Read more